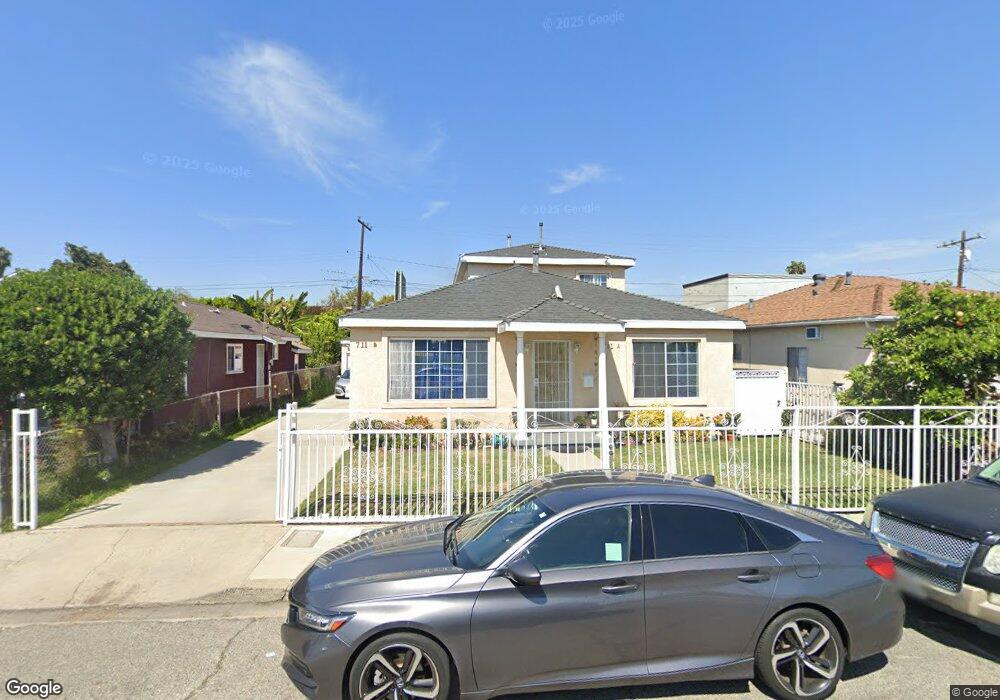
711 W Spruce St Compton, CA 90220
Estimated Value: $724,000 - $779,000
3
Beds
3
Baths
1,650
Sq Ft
$450/Sq Ft
Est. Value
About This Home
This home is located at 711 W Spruce St, Compton, CA 90220 and is currently estimated at $742,384, approximately $449 per square foot. 711 W Spruce St is a home located in Los Angeles County with nearby schools including Dickison Elementary School, Benjamin O. Davis Middle School, and Compton High School.
Ownership History
Date
Name
Owned For
Owner Type
Purchase Details
Closed on
Apr 18, 2018
Sold by
Reece John W and Reece Barbara R
Bought by
Reece John W and Reece Barbara R
Current Estimated Value
Purchase Details
Closed on
Aug 20, 2002
Sold by
Tucker James B and Tucker Phyllis Y
Bought by
Reece John W and Reece Barbara R
Home Financials for this Owner
Home Financials are based on the most recent Mortgage that was taken out on this home.
Original Mortgage
$106,250
Interest Rate
6.05%
Purchase Details
Closed on
Jan 5, 2000
Sold by
Tucker Family Trust Tucker James B And Phylli
Bought by
Tucker James B and Tucker Phyllis Y
Home Financials for this Owner
Home Financials are based on the most recent Mortgage that was taken out on this home.
Original Mortgage
$100,000
Interest Rate
9.99%
Purchase Details
Closed on
Jan 6, 1998
Sold by
Tucker James B and Tucker Phyllis Y
Bought by
Tucker James B and Tucker Phyllis Y
Create a Home Valuation Report for This Property
The Home Valuation Report is an in-depth analysis detailing your home's value as well as a comparison with similar homes in the area
Home Values in the Area
Average Home Value in this Area
Purchase History
| Date | Buyer | Sale Price | Title Company |
|---|---|---|---|
| Reece John W | -- | None Available | |
| Reece John W | $125,000 | Equity Title | |
| Tucker James B | -- | California Counties Title Co | |
| Tucker James B | -- | -- |
Source: Public Records
Mortgage History
| Date | Status | Borrower | Loan Amount |
|---|---|---|---|
| Previous Owner | Reece John W | $106,250 | |
| Previous Owner | Tucker James B | $100,000 |
Source: Public Records
Tax History
| Year | Tax Paid | Tax Assessment Tax Assessment Total Assessment is a certain percentage of the fair market value that is determined by local assessors to be the total taxable value of land and additions on the property. | Land | Improvement |
|---|---|---|---|---|
| 2025 | $6,460 | $318,772 | $109,629 | $209,143 |
| 2024 | $6,460 | $312,523 | $107,480 | $205,043 |
| 2023 | $6,363 | $306,396 | $105,373 | $201,023 |
| 2022 | $5,381 | $300,389 | $103,307 | $197,082 |
| 2021 | $5,426 | $294,500 | $101,282 | $193,218 |
| 2020 | $5,333 | $291,481 | $100,244 | $191,237 |
| 2019 | $5,272 | $285,767 | $98,279 | $187,488 |
| 2018 | $5,123 | $280,164 | $96,352 | $183,812 |
| 2016 | $4,867 | $269,286 | $92,611 | $176,675 |
| 2015 | $4,654 | $265,242 | $91,220 | $174,022 |
| 2014 | $4,573 | $260,048 | $89,434 | $170,614 |
Source: Public Records
Map
Nearby Homes
- 720 W Cherry St
- 806 W Spruce St
- 619 W Cherry St
- 814 W Maple St
- 629 W Plum St
- 836 W Cedar St
- 521 W Cherry St
- 701 W 139th St
- 418 W Spruce St
- 409 W Cedar St
- 2062 E Hatchway St
- 910 W Palmer St
- 940 W Brazil St
- 905 N Hickory Ave
- 348 W Peach St
- 1808 N Grape Ave
- 653 W Compton Blvd
- 813 W Stockwell St
- 810 W Compton Blvd Unit 7
- 820 W Compton Blvd Unit 20
- 707 W Spruce St
- 713 W Spruce St
- 710 W Rosecrans Ave Unit 56
- 710 W Rosecrans Ave
- 701 W Spruce St
- 717 W Spruce St
- 704 W Rosecrans Ave
- 721 W Spruce St
- 641 W Spruce St
- 725 W Spruce St
- 724 W Rosecrans Ave
- 637 W Spruce St
- 730 W Rosecrans Ave
- 633 W Spruce St
- 740 Rosecrans Ave
- 631 W Spruce St
- 637 W Rosecrans Ave
- 1002 N Wilmington Ave
- 704 W Cherry St
- 714 W Cherry St
Your Personal Tour Guide
Ask me questions while you tour the home.