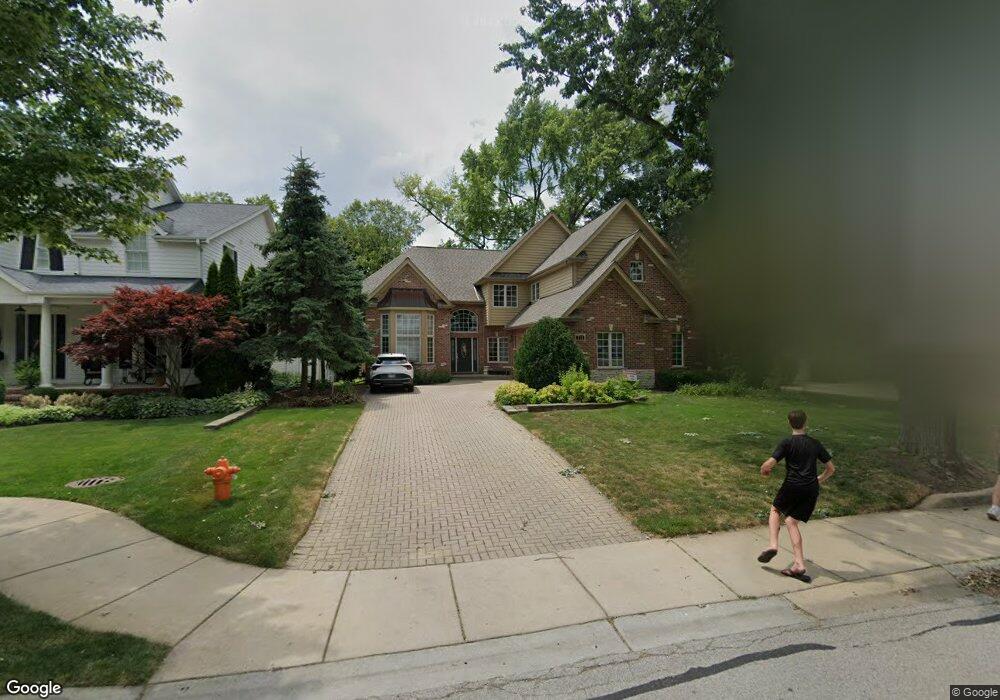
711 Wellner Rd Naperville, IL 60540
East Highland NeighborhoodEstimated Value: $1,213,000 - $1,589,000
4
Beds
5
Baths
3,795
Sq Ft
$379/Sq Ft
Est. Value
About This Home
This home is located at 711 Wellner Rd, Naperville, IL 60540 and is currently estimated at $1,438,433, approximately $379 per square foot. 711 Wellner Rd is a home located in DuPage County with nearby schools including Highlands Elementary School, Kennedy Junior High School, and Naperville Central High School.
Ownership History
Date
Name
Owned For
Owner Type
Purchase Details
Closed on
Oct 17, 2023
Sold by
Ung Feodor
Bought by
Ung Feodor and Feodor Ung Trust
Current Estimated Value
Purchase Details
Closed on
Jul 7, 2004
Sold by
First Midwest Bank
Bought by
Ung Feodor and Ung Jean O
Home Financials for this Owner
Home Financials are based on the most recent Mortgage that was taken out on this home.
Original Mortgage
$700,000
Interest Rate
5%
Mortgage Type
Purchase Money Mortgage
Purchase Details
Closed on
Apr 22, 2003
Sold by
Wiesbrook Steven P
Bought by
First Midwest Trust Co Na and Trust #6567
Purchase Details
Closed on
Jun 26, 1995
Sold by
Grewe Paul M and Grewe Joann M Petersen
Bought by
Wiesbrook Steven P
Home Financials for this Owner
Home Financials are based on the most recent Mortgage that was taken out on this home.
Original Mortgage
$147,240
Interest Rate
7.51%
Mortgage Type
FHA
Create a Home Valuation Report for This Property
The Home Valuation Report is an in-depth analysis detailing your home's value as well as a comparison with similar homes in the area
Home Values in the Area
Average Home Value in this Area
Purchase History
| Date | Buyer | Sale Price | Title Company |
|---|---|---|---|
| Ung Feodor | -- | None Listed On Document | |
| Ung Feodor | $899,000 | First American Title | |
| First Midwest Trust Co Na | $249,000 | Law Title | |
| Wiesbrook Steven P | $150,000 | First American Title Insuran |
Source: Public Records
Mortgage History
| Date | Status | Borrower | Loan Amount |
|---|---|---|---|
| Previous Owner | Ung Feodor | $700,000 | |
| Previous Owner | Wiesbrook Steven P | $147,240 |
Source: Public Records
Tax History
| Year | Tax Paid | Tax Assessment Tax Assessment Total Assessment is a certain percentage of the fair market value that is determined by local assessors to be the total taxable value of land and additions on the property. | Land | Improvement |
|---|---|---|---|---|
| 2024 | $22,407 | $373,766 | $123,946 | $249,820 |
| 2023 | $21,646 | $341,120 | $113,120 | $228,000 |
| 2022 | $21,689 | $341,120 | $113,120 | $228,000 |
| 2021 | $20,915 | $328,220 | $108,840 | $219,380 |
| 2020 | $20,478 | $322,320 | $106,880 | $215,440 |
| 2019 | $19,903 | $308,380 | $102,260 | $206,120 |
| 2018 | $20,537 | $317,920 | $105,420 | $212,500 |
| 2017 | $20,141 | $307,190 | $101,860 | $205,330 |
| 2016 | $19,759 | $296,090 | $98,180 | $197,910 |
| 2015 | $19,667 | $278,830 | $92,460 | $186,370 |
| 2014 | $18,917 | $269,180 | $77,050 | $192,130 |
| 2013 | $18,631 | $269,820 | $77,230 | $192,590 |
Source: Public Records
Map
Nearby Homes
- 706 S Loomis St Unit D
- 616 Driftwood Ct
- 707 Thornwood Dr
- 712 E Hillside Rd
- 661 Willow Rd
- 908 Julian Ct
- 740 Prairie Ave
- 488 S Columbia St
- 820 Prairie Ave
- 328 S Loomis St
- 923 Tim Tam Cir
- 313 W Gartner Rd
- 226 S Columbia St
- 316 Sycamore Dr Unit 11
- 203 S Columbia St
- 907 Secretariat Dr
- 845 Tulip Ln
- 932 E Chicago Ave
- 24 S Huffman St
- 308 Tamarack Ave
- 705 Wellner Rd
- 717 Wellner Rd
- 712 S Sleight St Unit 2
- 706 S Sleight St
- 723 Wellner Rd
- 714 S Sleight St
- 665 Wellner Rd
- 716 Wellner Rd
- 712 Wellner Rd
- 718 S Sleight St
- 706 Wellner Rd
- 729 Wellner Rd
- 664 S Sleight St
- 659 Wellner Rd
- 720 Wellner Rd
- 660 S Sleight St
- 726 Wellner Rd
- 722 S Sleight St
- 655 Wellner Rd
- 660 Wellner Rd
Your Personal Tour Guide
Ask me questions while you tour the home.