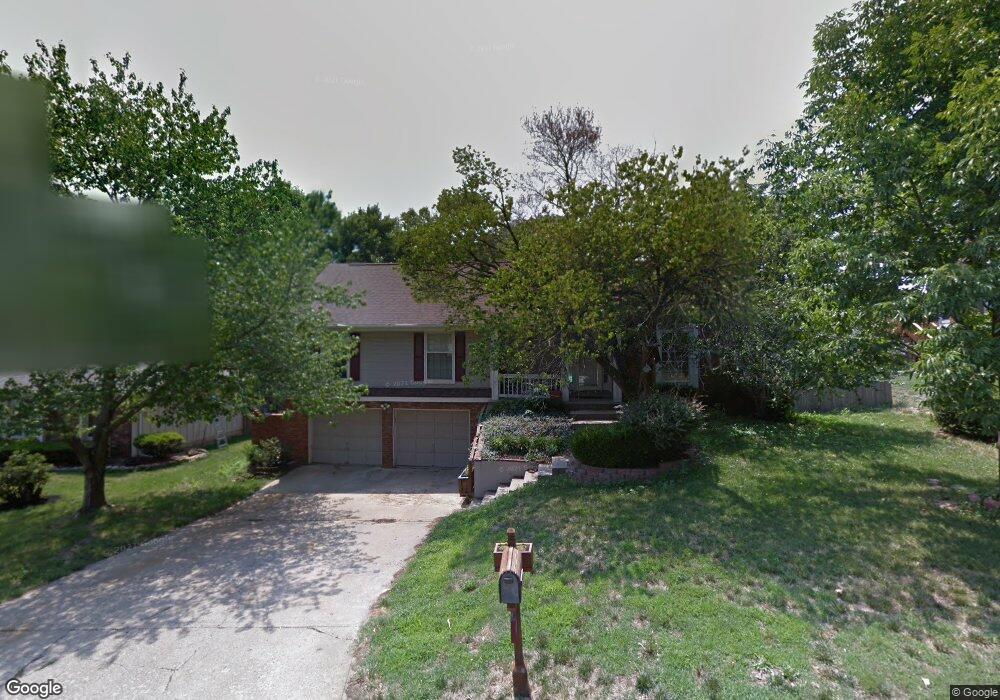
7110 N Winan Ave Kansas City, MO 64152
Estimated Value: $307,972 - $345,000
3
Beds
3
Baths
1,632
Sq Ft
$200/Sq Ft
Est. Value
About This Home
This home is located at 7110 N Winan Ave, Kansas City, MO 64152 and is currently estimated at $326,993, approximately $200 per square foot. 7110 N Winan Ave is a home located in Platte County with nearby schools including Hawthorn Elementary School, Lakeview Middle School, and Plaza Middle School.
Ownership History
Date
Name
Owned For
Owner Type
Purchase Details
Closed on
Oct 12, 2016
Sold by
Daily Jon M and Daily Kristan L
Bought by
Daily Kristan L and Daily Jon M
Current Estimated Value
Home Financials for this Owner
Home Financials are based on the most recent Mortgage that was taken out on this home.
Original Mortgage
$146,750
Outstanding Balance
$117,648
Interest Rate
3.46%
Mortgage Type
New Conventional
Estimated Equity
$209,345
Purchase Details
Closed on
Feb 17, 2010
Sold by
White Dale M and White Amanda
Bought by
Daily Jon M and Lowe Kristan L
Purchase Details
Closed on
Jan 22, 2006
Sold by
Ringo Steve
Bought by
White Dale M
Home Financials for this Owner
Home Financials are based on the most recent Mortgage that was taken out on this home.
Original Mortgage
$177,600
Interest Rate
5.25%
Mortgage Type
Adjustable Rate Mortgage/ARM
Create a Home Valuation Report for This Property
The Home Valuation Report is an in-depth analysis detailing your home's value as well as a comparison with similar homes in the area
Home Values in the Area
Average Home Value in this Area
Purchase History
| Date | Buyer | Sale Price | Title Company |
|---|---|---|---|
| Daily Kristan L | -- | Alliance Title Llc | |
| Daily Jon M | -- | -- | |
| White Dale M | -- | Chciago Title |
Source: Public Records
Mortgage History
| Date | Status | Borrower | Loan Amount |
|---|---|---|---|
| Open | Daily Kristan L | $146,750 | |
| Previous Owner | White Dale M | $177,600 | |
| Closed | Daily Jon M | $0 |
Source: Public Records
Tax History Compared to Growth
Tax History
| Year | Tax Paid | Tax Assessment Tax Assessment Total Assessment is a certain percentage of the fair market value that is determined by local assessors to be the total taxable value of land and additions on the property. | Land | Improvement |
|---|---|---|---|---|
| 2024 | $3,025 | $40,564 | $6,909 | $33,655 |
| 2023 | $3,025 | $40,564 | $6,909 | $33,655 |
| 2022 | $2,714 | $35,929 | $6,909 | $29,020 |
| 2021 | $2,724 | $35,929 | $6,909 | $29,020 |
| 2020 | $2,444 | $31,600 | $6,223 | $25,377 |
| 2019 | $2,444 | $31,600 | $6,223 | $25,377 |
| 2018 | $2,351 | $29,961 | $4,180 | $25,781 |
| 2017 | $2,341 | $29,961 | $4,180 | $25,781 |
| 2016 | $2,379 | $29,961 | $4,180 | $25,781 |
| 2015 | $2,390 | $29,961 | $4,180 | $25,781 |
| 2013 | $2,321 | $29,961 | $0 | $0 |
Source: Public Records
Map
Nearby Homes
- 9807 NW 75th Terrace
- 10750 NW Meadow Lane Cir
- 6705 NW Mirror Lake Terrace
- 10414 NW Mirror Lake Dr
- 10315 NW Mirror Lake Dr
- 8580 NW 75th Terrace
- 6607 NW Quail Run Dr
- 6606 NW Quail Run Dr
- 6532 Claret
- 7607 NW Roberts Rd
- 7610 NW Westside Dr
- 8705 NW 74th St
- 7809 NW Scenic Dr
- 6540 Ridge Rd
- 5962 Oak Creek Ct
- 6526 Ridge Rd
- 7803 NW Lynns Ln
- 7600 NW Westside Dr
- 6420 N National Dr
- 7515 N Everton Ave
- 7108 N Winan Ave
- 9919 NW 71st Terrace
- 7100 N Winan Ave
- 10000 NW 71st St
- 9901 NW 71st Terrace
- 10011 NW 71st Terrace
- 7111 N Winan Ave
- 7105 N Winan Ave
- 9902 NW 71st St
- 10004 NW 71st St
- 9918 NW 71st Terrace
- 9819 NW 71st Terrace
- 9912 NW 71st Terrace
- 10000 NW 71st Terrace
- 9906 NW 71st Terrace
- 10010 NW 71st Terrace
- 9919 NW 71st St
- 9900 NW 71st Terrace
- 9813 NW 71st Terrace
- 10001 NW 71st St