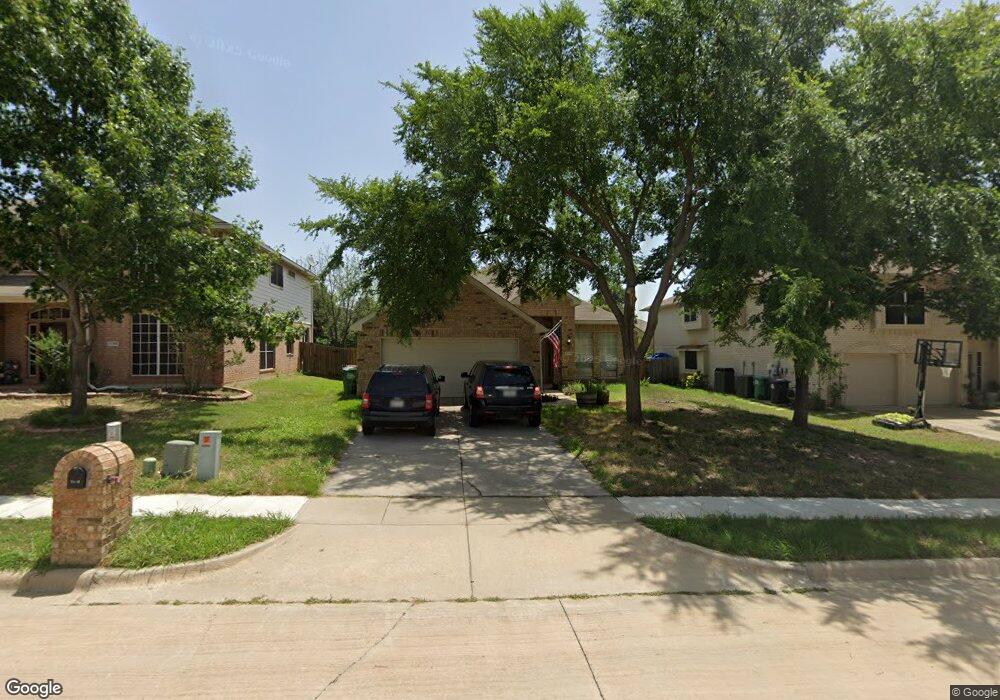
7113 Chaucer Dr Denton, TX 76210
South Denton NeighborhoodEstimated Value: $331,000 - $359,000
3
Beds
2
Baths
1,733
Sq Ft
$196/Sq Ft
Est. Value
About This Home
This home is located at 7113 Chaucer Dr, Denton, TX 76210 and is currently estimated at $339,380, approximately $195 per square foot. 7113 Chaucer Dr is a home located in Denton County with nearby schools including McNair Elementary School, Crownover Middle School, and Guyer High School.
Ownership History
Date
Name
Owned For
Owner Type
Purchase Details
Closed on
Aug 14, 2018
Sold by
Anderson Sheriley Z and Anderson Eric E
Bought by
Anderson Kristopher L and Anderson Kathryn L
Current Estimated Value
Home Financials for this Owner
Home Financials are based on the most recent Mortgage that was taken out on this home.
Original Mortgage
$199,000
Outstanding Balance
$172,823
Interest Rate
4.5%
Mortgage Type
Purchase Money Mortgage
Estimated Equity
$166,557
Purchase Details
Closed on
Sep 25, 2009
Sold by
Akins Richard A and Solis Irma
Bought by
Anderson Shirley Z and Anderson Eric E
Purchase Details
Closed on
Nov 28, 2000
Sold by
Gehan Homes Ltd
Bought by
Akins Richard A
Home Financials for this Owner
Home Financials are based on the most recent Mortgage that was taken out on this home.
Original Mortgage
$121,984
Interest Rate
7.84%
Mortgage Type
FHA
Create a Home Valuation Report for This Property
The Home Valuation Report is an in-depth analysis detailing your home's value as well as a comparison with similar homes in the area
Home Values in the Area
Average Home Value in this Area
Purchase History
| Date | Buyer | Sale Price | Title Company |
|---|---|---|---|
| Anderson Kristopher L | -- | Republic Title Of Texas Inc | |
| Anderson Shirley Z | -- | Hftc | |
| Akins Richard A | -- | -- |
Source: Public Records
Mortgage History
| Date | Status | Borrower | Loan Amount |
|---|---|---|---|
| Open | Anderson Kristopher L | $199,000 | |
| Previous Owner | Akins Richard A | $121,984 |
Source: Public Records
Tax History Compared to Growth
Tax History
| Year | Tax Paid | Tax Assessment Tax Assessment Total Assessment is a certain percentage of the fair market value that is determined by local assessors to be the total taxable value of land and additions on the property. | Land | Improvement |
|---|---|---|---|---|
| 2025 | $5,026 | $309,589 | $94,080 | $215,509 |
| 2024 | $6,222 | $322,345 | $94,080 | $228,265 |
| 2023 | $5,321 | $341,378 | $94,080 | $247,298 |
| 2022 | $6,183 | $291,272 | $94,080 | $197,192 |
| 2021 | $4,723 | $212,456 | $54,887 | $157,569 |
| 2020 | $4,781 | $209,163 | $54,887 | $154,276 |
| 2019 | $4,947 | $207,327 | $54,887 | $152,440 |
| 2018 | $4,340 | $179,645 | $54,887 | $124,758 |
| 2017 | $4,330 | $175,192 | $54,887 | $120,305 |
| 2016 | $3,988 | $161,330 | $39,205 | $122,125 |
| 2015 | $3,498 | $153,911 | $39,205 | $114,706 |
| 2014 | $3,498 | $139,814 | $31,364 | $108,450 |
| 2013 | -- | $141,218 | $31,364 | $109,854 |
Source: Public Records
Map
Nearby Homes
- 7301 Chaucer Dr
- 7100 Frost Ln
- 7305 Mira Vista Dr
- 2109 Hemingway Dr
- 2109 Doecrest Dr
- 1617 Glendora Ct
- 1605 Cordero Ct
- 1917 Prescott Downs Dr
- 1612 Marble Cove Ln
- 1917 Belmont Park Dr
- 7804 Hidden Path Ln
- 2112 Del Mar Ct
- 7912 Hidden Path Ln
- 2005 Creekdale Dr
- 2316 Del Mar Ct
- 2901 Saddle Dr
- 2825 Desert Dr
- 1201 Buena Vista Dr
- 2401 Creekdale Dr
- 2924 Desert Dr
- 7109 Chaucer Dr
- 7201 Chaucer Dr
- 7205 Chaucer Dr
- 7112 Frost Ln
- 7108 Frost Ln
- 7200 Frost Ln
- 7101 Chaucer Dr
- 7104 Frost Ln
- 7204 Frost Ln
- 7209 Chaucer Dr
- 7112 Chaucer Dr
- 7200 Chaucer Dr
- 7108 Chaucer Dr
- 7208 Frost Ln
- 7204 Chaucer Dr
- 7104 Chaucer Dr
- 7017 Chaucer Dr
- 7213 Chaucer Dr
- 7016 Frost Ln
- 7212 Frost Ln