Estimated Value: $289,000 - $364,000
4
Beds
3
Baths
2,596
Sq Ft
$126/Sq Ft
Est. Value
About This Home
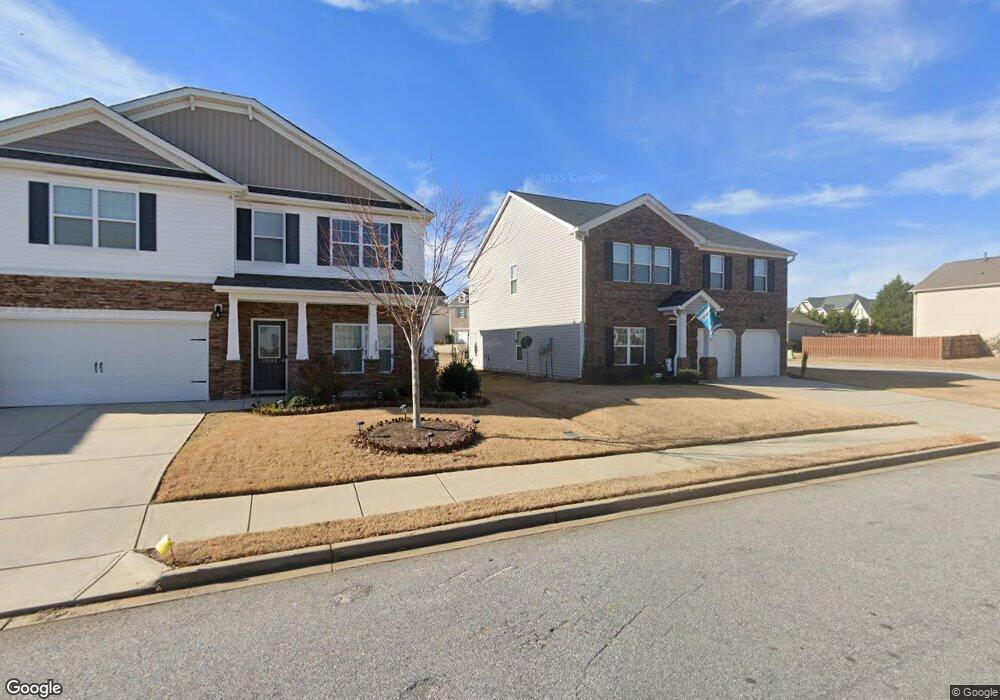
This home is located at 712 Cerons St, Moore, SC 29369 and is currently estimated at $328,028, approximately $126 per square foot. 712 Cerons St is a home located in Spartanburg County with nearby schools including Dorman High School Freshman Campus, Dorman High School, and Westgate Christian School.
Ownership History
Date
Name
Owned For
Owner Type
Purchase Details
Closed on
Jun 6, 2024
Sold by
Vanvanbui Van Van and Nguyen Hien Thi
Bought by
Waddell Amy C
Current Estimated Value
Home Financials for this Owner
Home Financials are based on the most recent Mortgage that was taken out on this home.
Original Mortgage
$200,000
Outstanding Balance
$197,520
Interest Rate
7.17%
Mortgage Type
New Conventional
Estimated Equity
$130,508
Purchase Details
Closed on
Aug 28, 2017
Sold by
D R Horton Crown Llc
Bought by
Vanvanbui Van Van and Nguyen Hien Thi
Home Financials for this Owner
Home Financials are based on the most recent Mortgage that was taken out on this home.
Original Mortgage
$155,580
Interest Rate
4.03%
Mortgage Type
New Conventional
Purchase Details
Closed on
Jan 4, 2017
Sold by
Mark Iii Properties Inc
Bought by
D R Horton Crown Llc
Create a Home Valuation Report for This Property
The Home Valuation Report is an in-depth analysis detailing your home's value as well as a comparison with similar homes in the area
Home Values in the Area
Average Home Value in this Area
Purchase History
| Date | Buyer | Sale Price | Title Company |
|---|---|---|---|
| Waddell Amy C | $325,000 | None Listed On Document | |
| Vanvanbui Van Van | $197,990 | None Available | |
| D R Horton Crown Llc | $142,000 | None Available |
Source: Public Records
Mortgage History
| Date | Status | Borrower | Loan Amount |
|---|---|---|---|
| Open | Waddell Amy C | $200,000 | |
| Previous Owner | Vanvanbui Van Van | $155,580 |
Source: Public Records
Tax History
| Year | Tax Paid | Tax Assessment Tax Assessment Total Assessment is a certain percentage of the fair market value that is determined by local assessors to be the total taxable value of land and additions on the property. | Land | Improvement |
|---|---|---|---|---|
| 2025 | $5,095 | $13,000 | $1,392 | $11,608 |
| 2024 | $5,095 | $9,103 | $1,131 | $7,972 |
| 2023 | $5,095 | $13,656 | $1,697 | $11,959 |
Source: Public Records
Map
Nearby Homes
- 442 Listrac Dr
- 237 Medoc Ln
- 2141 Pomerol Dr
- 708 Larado Ct
- 508 Sierra Ridge Ct
- 6002 Haddington Dr
- 6086 Haddington Dr
- 32 Arbours West Ln
- 123 Churchill Ave
- 1308 Saddle Ct
- 1149 Merlot Ct
- 214 Golden Pond Ct
- 2292 Davenport Ct
- 919 Equine Dr
- 2054 Lachaise Ln
- 1332 Saddle Ct
- 2281 Davenport Ct
- 422 Rambling Rose Way
- 2011 Lachaise Ln
- 225 Georgetown Ct
- 712 Cerons St
- 712 Cerrons Ct
- 716 Cerons St
- 708 Cerons St
- 720 Cerons St
- 704 Cerons St Unit 179
- 704 Cerons St
- 458 Listrac Dr
- 404 Medoc Ln
- 724 Cerons St
- 715 Cerons St
- 715 Cerons St Unit 211
- 454 Listrac Dr
- 2090 Pomerol Dr
- 2078 Pomerol Dr
- 719 Cerons St
- 2094 Pomerol Dr
- 728 Cerons St
- 2074 Pomerol Dr
- 238 Medoc Ln
Your Personal Tour Guide
Ask me questions while you tour the home.