Estimated Value: $492,000 - $515,000
4
Beds
4
Baths
2,546
Sq Ft
$200/Sq Ft
Est. Value
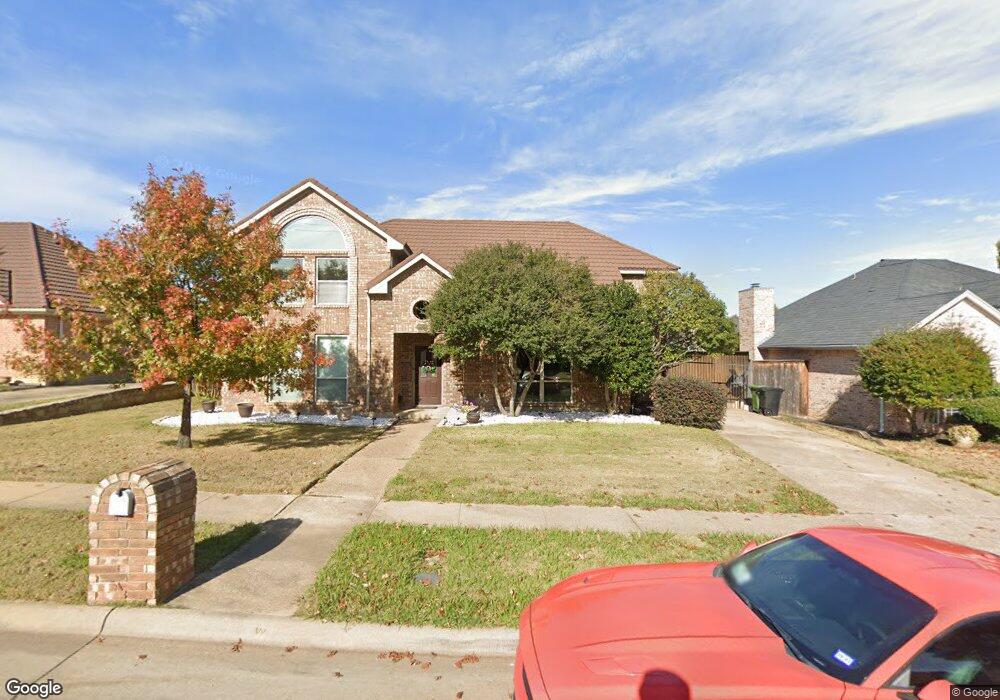
About This Home
This home is located at 712 Evergreen Dr, Hurst, TX 76054 and is currently estimated at $508,908, approximately $199 per square foot. 712 Evergreen Dr is a home located in Tarrant County with nearby schools including W.A. Porter Elementary School, Smithfield Middle School, and Birdville High School.
Ownership History
Date
Name
Owned For
Owner Type
Purchase Details
Closed on
Dec 28, 2018
Sold by
Shclottog Christina Renae
Bought by
Schlottog Karrie Michelle and Gartner Karrie Michelle
Current Estimated Value
Purchase Details
Closed on
Mar 8, 2013
Sold by
Smith Lisa Sandlin and Smith Lisa Rene
Bought by
Schlottog Christy and Schlottog Karrie
Home Financials for this Owner
Home Financials are based on the most recent Mortgage that was taken out on this home.
Original Mortgage
$215,600
Interest Rate
3.44%
Mortgage Type
New Conventional
Purchase Details
Closed on
Oct 16, 2007
Sold by
Smith Lisa Sandlin and Bradley Lisa S
Bought by
Bradley Jason P
Home Financials for this Owner
Home Financials are based on the most recent Mortgage that was taken out on this home.
Original Mortgage
$162,400
Interest Rate
6.32%
Mortgage Type
Credit Line Revolving
Create a Home Valuation Report for This Property
The Home Valuation Report is an in-depth analysis detailing your home's value as well as a comparison with similar homes in the area
Home Values in the Area
Average Home Value in this Area
Purchase History
| Date | Buyer | Sale Price | Title Company |
|---|---|---|---|
| Schlottog Karrie Michelle | -- | None Available | |
| Schlottog Christy | -- | None Available | |
| Bradley Jason P | -- | None Available |
Source: Public Records
Mortgage History
| Date | Status | Borrower | Loan Amount |
|---|---|---|---|
| Previous Owner | Schlottog Christy | $215,600 | |
| Previous Owner | Bradley Jason P | $162,400 |
Source: Public Records
Tax History
| Year | Tax Paid | Tax Assessment Tax Assessment Total Assessment is a certain percentage of the fair market value that is determined by local assessors to be the total taxable value of land and additions on the property. | Land | Improvement |
|---|---|---|---|---|
| 2025 | $8,697 | $476,094 | $90,000 | $386,094 |
| 2024 | $8,697 | $476,094 | $90,000 | $386,094 |
| 2023 | $10,181 | $506,750 | $90,000 | $416,750 |
| 2022 | $10,013 | $416,593 | $55,000 | $361,593 |
| 2021 | $9,551 | $368,175 | $55,000 | $313,175 |
| 2020 | $8,961 | $348,694 | $55,000 | $293,694 |
| 2019 | $8,482 | $362,302 | $55,000 | $307,302 |
| 2018 | $7,007 | $293,352 | $55,000 | $238,352 |
| 2017 | $7,116 | $286,983 | $55,000 | $231,983 |
| 2016 | $6,469 | $251,080 | $40,000 | $211,080 |
| 2015 | $5,430 | $220,400 | $25,000 | $195,400 |
| 2014 | $5,430 | $220,400 | $25,000 | $195,400 |
Source: Public Records
Map
Nearby Homes
- 3121 Oakdale Dr
- 717 Ashley Dr
- 3220 David Dr
- 3229 David Dr
- 6812 Switchback Trail
- 2925 Ridgewood Dr
- 6708 Nob Hill Ct
- 6704 Nob Hill Ct
- 3308 Texas Trail Ct
- 9120 Nob Hill Dr
- 753 Toni Dr
- 716 Bridget Way
- 712 Springhill Dr
- 8966 Hialeah Cir S
- 9205 Cooper Ct
- 736 Springhill Dr
- 8955 Tamiami Ct
- 7312 Hialeah Cir W
- 3512 Osprey Dr
- 713 Corsair Ct
- 716 Evergreen Dr
- 708 Evergreen Dr
- 717 Herman Dr
- 709 Herman Dr
- 720 Evergreen Dr
- 704 Evergreen Dr
- 721 Herman Dr
- 713 Evergreen Dr
- 705 Herman Dr
- 705 Evergreen Dr
- 717 Evergreen Dr
- 700 Evergreen Dr
- 725 Herman Dr
- 701 Herman Dr
- 712 Herman Dr
- 701 Evergreen Dr
- 724 Evergreen Dr
- 716 Herman Dr
- 708 Herman Dr
- 712 Highland Park Dr
Your Personal Tour Guide
Ask me questions while you tour the home.