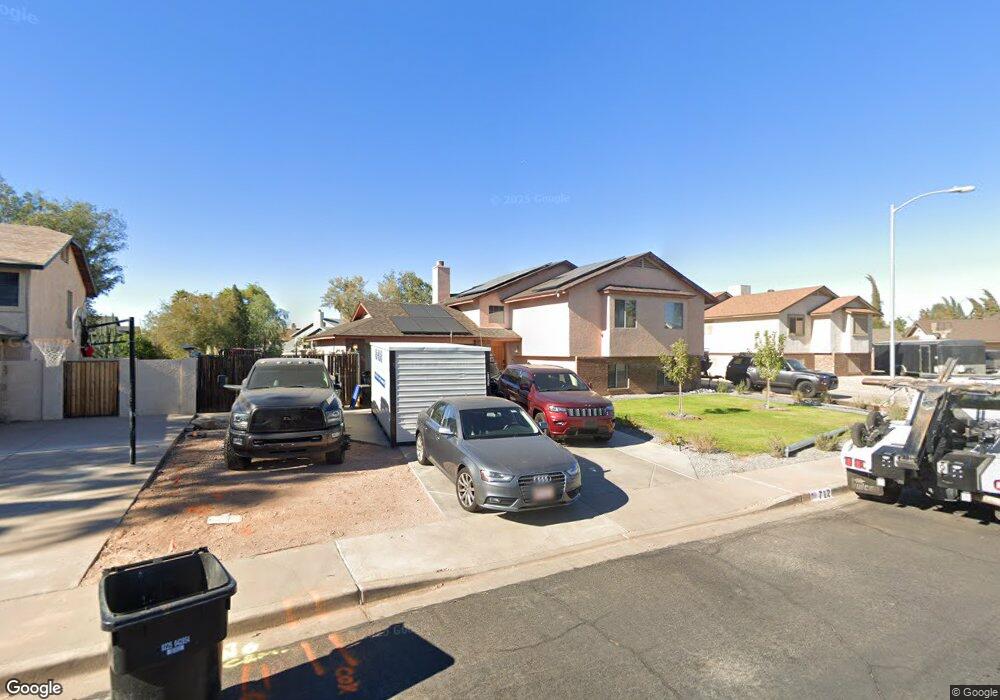
712 N Banning Cir Mesa, AZ 85205
Central Mesa East NeighborhoodEstimated Value: $412,395 - $533,000
4
Beds
2
Baths
2,149
Sq Ft
$229/Sq Ft
Est. Value
About This Home
This home is located at 712 N Banning Cir, Mesa, AZ 85205 and is currently estimated at $492,349, approximately $229 per square foot. 712 N Banning Cir is a home located in Maricopa County with nearby schools including O'Connor Elementary School, Franklin at Brimhall Elementary School, and Franklin West Elementary School.
Ownership History
Date
Name
Owned For
Owner Type
Purchase Details
Closed on
Oct 31, 2003
Sold by
Rivera Billie Jo
Bought by
Rivera Edwin
Current Estimated Value
Home Financials for this Owner
Home Financials are based on the most recent Mortgage that was taken out on this home.
Original Mortgage
$140,250
Interest Rate
8.6%
Mortgage Type
Purchase Money Mortgage
Purchase Details
Closed on
Oct 29, 2003
Sold by
Bray Bradley Russell and Robinson Bray Candyce G
Bought by
Rivera Edwin
Home Financials for this Owner
Home Financials are based on the most recent Mortgage that was taken out on this home.
Original Mortgage
$140,250
Interest Rate
8.6%
Mortgage Type
Purchase Money Mortgage
Purchase Details
Closed on
Aug 14, 1997
Sold by
Frost Jack C
Bought by
Bray Bradley Russell and Robinson Bray Candyce G
Create a Home Valuation Report for This Property
The Home Valuation Report is an in-depth analysis detailing your home's value as well as a comparison with similar homes in the area
Home Values in the Area
Average Home Value in this Area
Purchase History
| Date | Buyer | Sale Price | Title Company |
|---|---|---|---|
| Rivera Edwin | -- | Security Title Agency | |
| Rivera Edwin | $187,000 | Security Title Agency | |
| Bray Bradley Russell | -- | Chicago Title Insurance Co |
Source: Public Records
Mortgage History
| Date | Status | Borrower | Loan Amount |
|---|---|---|---|
| Previous Owner | Rivera Edwin | $140,250 | |
| Previous Owner | Rivera Edwin | $140,250 |
Source: Public Records
Tax History
| Year | Tax Paid | Tax Assessment Tax Assessment Total Assessment is a certain percentage of the fair market value that is determined by local assessors to be the total taxable value of land and additions on the property. | Land | Improvement |
|---|---|---|---|---|
| 2025 | $1,422 | $17,121 | -- | -- |
| 2024 | $1,437 | $16,305 | -- | -- |
| 2023 | $1,437 | $33,410 | $6,680 | $26,730 |
| 2022 | $1,406 | $26,070 | $5,210 | $20,860 |
| 2021 | $1,444 | $24,170 | $4,830 | $19,340 |
| 2020 | $1,425 | $22,230 | $4,440 | $17,790 |
| 2019 | $1,320 | $20,080 | $4,010 | $16,070 |
| 2018 | $1,260 | $18,630 | $3,720 | $14,910 |
| 2017 | $1,221 | $16,130 | $3,220 | $12,910 |
| 2016 | $1,199 | $15,060 | $3,010 | $12,050 |
| 2015 | $1,132 | $13,700 | $2,740 | $10,960 |
Source: Public Records
Map
Nearby Homes
- 5056 E Dallas St
- 5051 E Adobe St
- 5135 E Evergreen St Unit 1165
- 5135 E Evergreen St Unit 1253
- 5228 E Des Moines St
- 4933 E Downing St
- 5252 E Des Moines St
- 503 N Balboa
- 5331 E Dodge St
- 5345 E Dallas St
- 5136 E Evergreen St Unit 1031
- 5349 E Dallas St
- 5354 E Ellis St
- 5410 E Dodge St
- 5409 E Decatur St
- 5422 E Des Moines St
- 5315 E Cicero St
- 840 N Arvada
- 832 N Alvaro Cir
- 5502 E Duncan St
- 704 N Banning Cir
- 720 N Banning Cir
- 5062 E Dallas St
- 5064 E Dartmouth Cir
- 5061 E Dartmouth Cir
- 724 N Banning Cir
- 713 N Banning Cir
- 705 N Banning Cir
- 721 N Banning Cir
- 5058 E Dartmouth Cir
- 725 N Banning Cir
- 5107 E Dallas St
- 5115 E Dallas St
- 5063 E Dallas St
- 5055 E Dartmouth Cir
- 5111 E Downing St
- 5050 E Dallas St
- 5119 E Downing St
- 5123 E Dallas St
- 5065 E Downing St
Your Personal Tour Guide
Ask me questions while you tour the home.