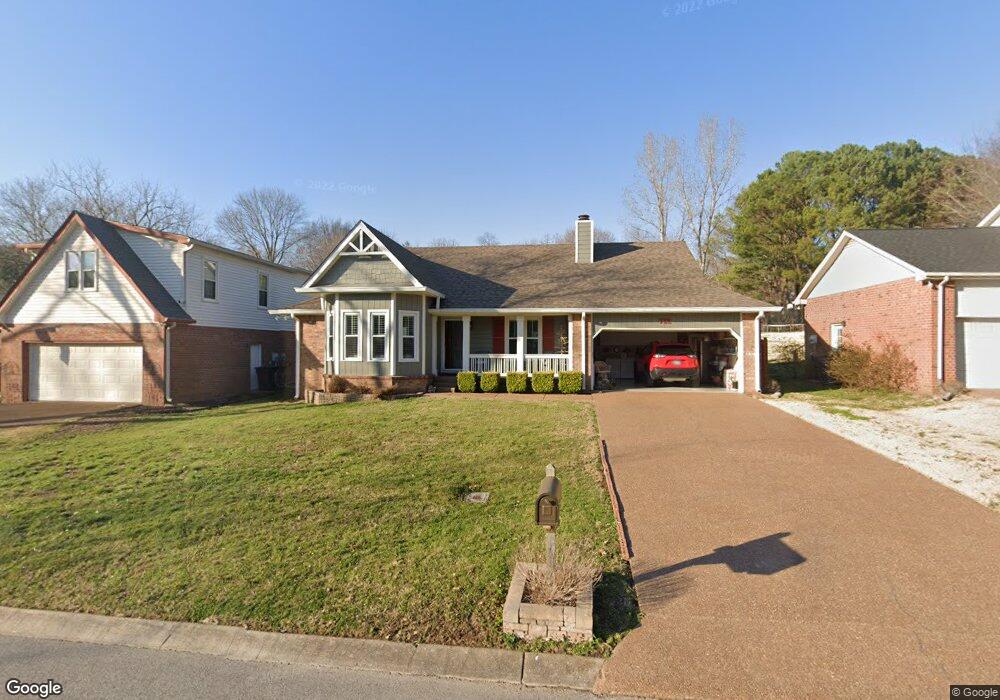
712 Watson Branch Dr Franklin, TN 37064
McEwen NeighborhoodEstimated Value: $549,445 - $602,000
--
Bed
2
Baths
1,470
Sq Ft
$393/Sq Ft
Est. Value
About This Home
This home is located at 712 Watson Branch Dr, Franklin, TN 37064 and is currently estimated at $577,611, approximately $392 per square foot. 712 Watson Branch Dr is a home located in Williamson County with nearby schools including Moore Elementary School, Freedom Intermediate School, and Freedom Middle School.
Ownership History
Date
Name
Owned For
Owner Type
Purchase Details
Closed on
Apr 27, 2017
Sold by
Horton Mark and Horton Felecia Dianne
Bought by
Almon Thomas E and Almon Carolyn S
Current Estimated Value
Purchase Details
Closed on
Dec 8, 2016
Sold by
Lankford Odessa
Bought by
Horton Mark and Horton Felecia Dianee
Purchase Details
Closed on
Jun 9, 2006
Sold by
Murphy Michael T and Murphy Summer T
Bought by
Lankford Odessa
Home Financials for this Owner
Home Financials are based on the most recent Mortgage that was taken out on this home.
Original Mortgage
$184,875
Interest Rate
6.51%
Mortgage Type
Purchase Money Mortgage
Purchase Details
Closed on
Sep 27, 2002
Sold by
Smith Richard K and Smith Sharlene A
Bought by
Murphy Michael T and Murphy Summer T
Home Financials for this Owner
Home Financials are based on the most recent Mortgage that was taken out on this home.
Original Mortgage
$166,600
Interest Rate
6.27%
Mortgage Type
VA
Create a Home Valuation Report for This Property
The Home Valuation Report is an in-depth analysis detailing your home's value as well as a comparison with similar homes in the area
Home Values in the Area
Average Home Value in this Area
Purchase History
| Date | Buyer | Sale Price | Title Company |
|---|---|---|---|
| Almon Thomas E | $330,000 | None Available | |
| Horton Mark | $220,000 | None Available | |
| Lankford Odessa | $217,500 | Bankers Title & Escrow Corp | |
| Murphy Michael T | $166,600 | -- |
Source: Public Records
Mortgage History
| Date | Status | Borrower | Loan Amount |
|---|---|---|---|
| Previous Owner | Lankford Odessa | $184,875 | |
| Previous Owner | Murphy Michael T | $166,600 |
Source: Public Records
Tax History Compared to Growth
Tax History
| Year | Tax Paid | Tax Assessment Tax Assessment Total Assessment is a certain percentage of the fair market value that is determined by local assessors to be the total taxable value of land and additions on the property. | Land | Improvement |
|---|---|---|---|---|
| 2024 | $2,436 | $86,050 | $22,500 | $63,550 |
| 2023 | $2,342 | $86,050 | $22,500 | $63,550 |
| 2022 | $2,342 | $86,050 | $22,500 | $63,550 |
| 2021 | $2,342 | $86,050 | $22,500 | $63,550 |
| 2020 | $2,076 | $64,325 | $20,000 | $44,325 |
| 2019 | $2,076 | $64,325 | $20,000 | $44,325 |
| 2018 | $2,031 | $64,325 | $20,000 | $44,325 |
| 2017 | $1,998 | $64,325 | $20,000 | $44,325 |
| 2016 | $1,992 | $64,325 | $20,000 | $44,325 |
| 2015 | -- | $49,425 | $16,250 | $33,175 |
| 2014 | -- | $49,425 | $16,250 | $33,175 |
Source: Public Records
Map
Nearby Homes
- 713 Sugartree Ln
- 697 Watson Branch Dr
- 205 Jennette Place
- 2741 Kennedy Ct Unit 2741
- 521 Shadycrest Ln
- 2801 Kennedy Ct Unit 2801
- 2433 Kennedy Ct Unit 2433
- 521 Maplegrove Dr
- 2100 Roderick Place W
- 2077 Roderick Cir
- 306 Battery Ct
- 413 Chelsey Cove
- 1011 Murfreesboro Rd Unit E3
- 1011 Murfreesboro Rd Unit B2
- 1011 Murfreesboro Rd Unit D3
- 425 Chelsey Cove
- 624 Burghley Ln
- 1107 Culpepper Cir
- 208 Turnbrook Ln
- 1143 Buckingham Cir
- 716 Watson Branch Dr
- 708 Watson Branch Dr
- 705 Branch Ct
- 720 Watson Branch Dr
- 717 Watson Branch Dr
- 713 Watson Branch Dr
- 701 Branch Ct
- 719 Watson Branch Dr
- 709 Watson Branch Dr
- 708 Sugartree Ln
- 708 Branch Ct
- 724 Watson Branch Dr
- 700 Branch Ct
- 704 Sugartree Ln
- 721 Watson Branch Dr
- 707 Watson Branch Dr
- 722 Shadycrest Ln
- 726 Shadycrest Ln
- 704 Branch Ct
- 720 Shadycrest Ln