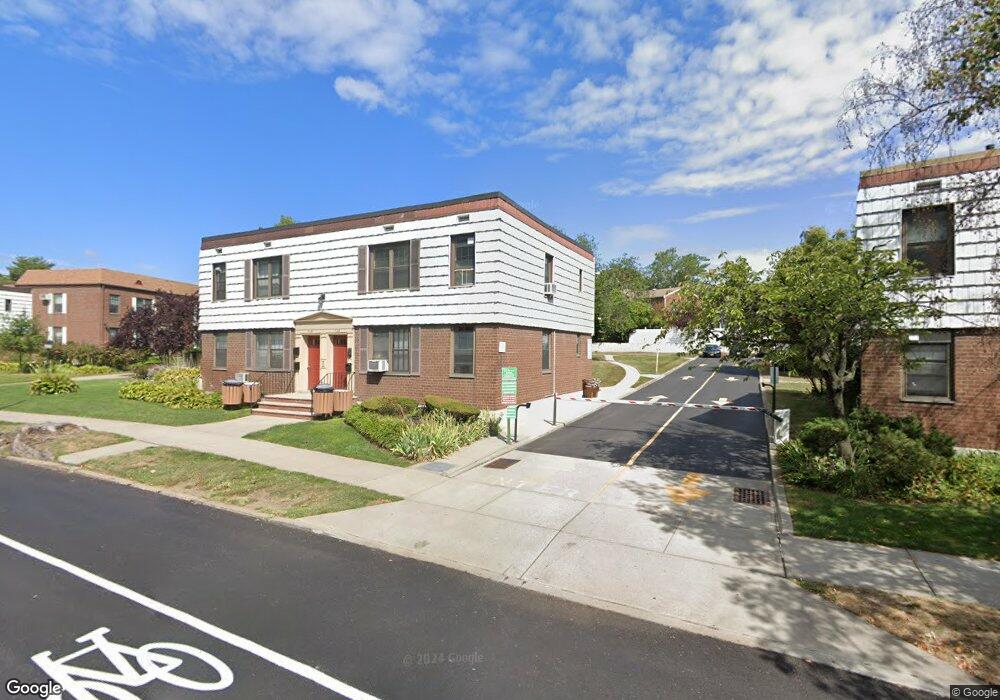
7129 Park Dr E Unit B Flushing, NY 11367
Kew Gardens Hills NeighborhoodEstimated Value: $361,931 - $470,000
1
Bed
1
Bath
635
Sq Ft
$661/Sq Ft
Est. Value
About This Home
This home is located at 7129 Park Dr E Unit B, Flushing, NY 11367 and is currently estimated at $419,983, approximately $661 per square foot. 7129 Park Dr E Unit B is a home located in Queens County with nearby schools including P.S. 164 - Queens Valley, I.S. 250 - The Robert F. Kennedy Community Middle School, and Yeshiva Of Central Queens.
Ownership History
Date
Name
Owned For
Owner Type
Purchase Details
Closed on
Sep 17, 2015
Sold by
Zhang Rong Hua
Bought by
Cheung Yik Kin and Zhang Li-E
Current Estimated Value
Home Financials for this Owner
Home Financials are based on the most recent Mortgage that was taken out on this home.
Original Mortgage
$110,000
Outstanding Balance
$86,574
Interest Rate
3.97%
Mortgage Type
New Conventional
Estimated Equity
$333,409
Purchase Details
Closed on
May 3, 2013
Sold by
Huang Junwei and Liang Wanjun
Bought by
Zhang Rong Hua
Purchase Details
Closed on
Mar 18, 2010
Sold by
Pare Francis G and Pu Yuan Qing
Bought by
Huang Junwei and Liang Wanjun
Home Financials for this Owner
Home Financials are based on the most recent Mortgage that was taken out on this home.
Original Mortgage
$176,800
Interest Rate
4.94%
Mortgage Type
Purchase Money Mortgage
Purchase Details
Closed on
Jul 1, 2009
Sold by
Kew Hills Llc
Bought by
Pare Francis G and Pu Yuan Q
Home Financials for this Owner
Home Financials are based on the most recent Mortgage that was taken out on this home.
Original Mortgage
$191,000
Interest Rate
5.47%
Mortgage Type
Purchase Money Mortgage
Create a Home Valuation Report for This Property
The Home Valuation Report is an in-depth analysis detailing your home's value as well as a comparison with similar homes in the area
Home Values in the Area
Average Home Value in this Area
Purchase History
| Date | Buyer | Sale Price | Title Company |
|---|---|---|---|
| Cheung Yik Kin | $325,000 | -- | |
| Zhang Rong Hua | $250,000 | -- | |
| Huang Junwei | $236,800 | -- | |
| Pare Francis G | $239,999 | -- |
Source: Public Records
Mortgage History
| Date | Status | Borrower | Loan Amount |
|---|---|---|---|
| Open | Cheung Yik Kin | $110,000 | |
| Previous Owner | Huang Junwei | $176,800 | |
| Previous Owner | Pare Francis G | $191,000 |
Source: Public Records
Tax History
| Year | Tax Paid | Tax Assessment Tax Assessment Total Assessment is a certain percentage of the fair market value that is determined by local assessors to be the total taxable value of land and additions on the property. | Land | Improvement |
|---|---|---|---|---|
| 2025 | $3,057 | $25,384 | $4,152 | $21,232 |
| 2024 | $2,198 | $24,449 | $4,152 | $20,297 |
| 2023 | $3,164 | $25,311 | $4,152 | $21,159 |
| 2022 | $3,059 | $25,160 | $4,152 | $21,008 |
| 2021 | $2,887 | $23,531 | $4,152 | $19,379 |
| 2020 | $2,885 | $26,539 | $4,152 | $22,387 |
| 2019 | $2,715 | $25,760 | $4,152 | $21,608 |
| 2018 | $2,555 | $20,091 | $4,152 | $15,939 |
| 2017 | $2,437 | $19,163 | $4,152 | $15,011 |
| 2016 | $2,085 | $19,163 | $4,152 | $15,011 |
| 2015 | $1,534 | $17,728 | $4,152 | $13,576 |
| 2014 | $1,534 | $16,870 | $4,143 | $12,727 |
Source: Public Records
Map
Nearby Homes
- 71-17 Park Dr E Unit B
- 7107 Park Dr E Unit B
- 71-43 Park Dr E Unit A
- 69-92 136th St Unit A
- 70-43B Park Dr E
- 70-47 Park Dr E Unit A
- 70-07 Park Dr E Unit A
- 6951 136th St Unit 2A
- 135-02 Jewel Ave Unit A
- 135-23 Jewel Ave Unit A
- 138-01A Jewel Ave Unit 1A
- 13772 70th Ave
- 68-76 136th St Unit A
- 68-76 136th St Unit B
- 7012 141st St
- 6860 136th St Unit A
- 138-29 Jewel Ave Unit 3D
- 138-55 Jewel Ave Unit 2nd Fl
- 68-38 136th St Unit A
- 6912 138th St Unit B
- 7129 Park Dr E Unit 2 Fl
- 7125 Park Dr E Unit B
- 7129 Park Dr E
- 7129 Park Dr E Unit B
- 7129 Park Dr E Unit A
- 7127 Park Dr E Unit B
- 7127 Park Dr E Unit A
- 7125 Park Dr E Unit B
- 7125 Park Dr E Unit A
- 7127 Park Dr E
- 7129 Park Dr E
- 7127 Park Dr E Unit B
- 71-27 Park Dr E Unit B
- 71-25 Park Dr E Unit B
- 7123 Park Dr E Unit B
- 7123 Park Dr E Unit A
- 7123 Park Dr E Unit 2B
- 7121 Park Dr E Unit B
- 7121 Park Dr E Unit A
- 7121 Park Dr E
Your Personal Tour Guide
Ask me questions while you tour the home.