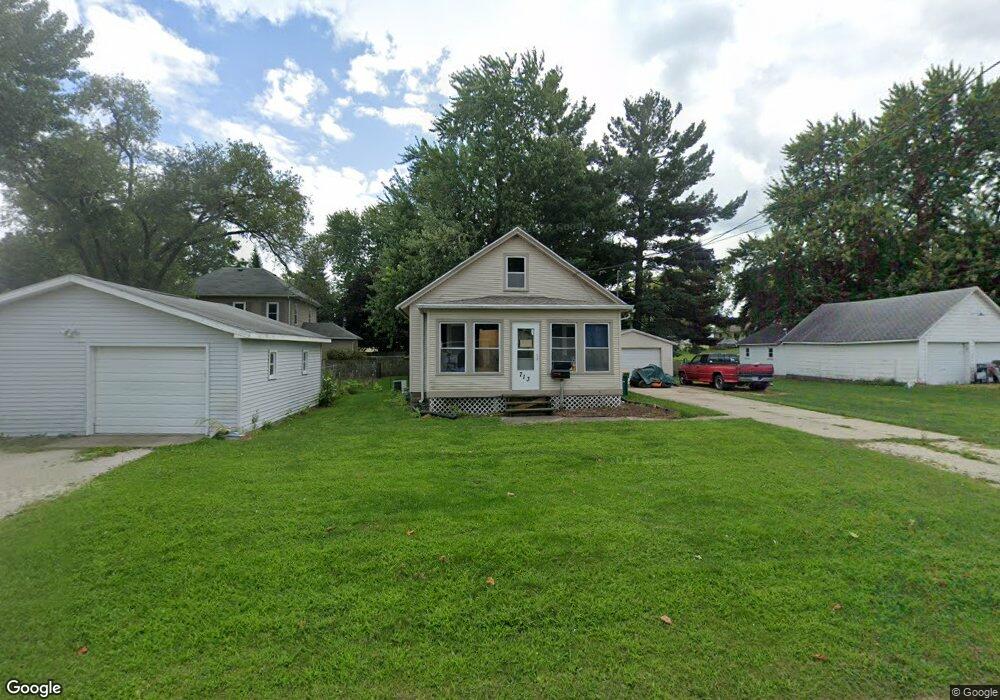
713 4th St NE Independence, IA 50644
Estimated Value: $90,000 - $140,000
3
Beds
2
Baths
1,134
Sq Ft
$106/Sq Ft
Est. Value
About This Home
This home is located at 713 4th St NE, Independence, IA 50644 and is currently estimated at $120,130, approximately $105 per square foot. 713 4th St NE is a home located in Buchanan County with nearby schools including West Elementary School, East Elementary School, and Independence Junior/Senior High School.
Ownership History
Date
Name
Owned For
Owner Type
Purchase Details
Closed on
Aug 4, 2023
Sold by
Jacobsen David J and Jacobsen Karlita K
Bought by
Lellig Robert
Current Estimated Value
Home Financials for this Owner
Home Financials are based on the most recent Mortgage that was taken out on this home.
Original Mortgage
$87,849
Outstanding Balance
$85,795
Interest Rate
6.67%
Mortgage Type
VA
Estimated Equity
$34,335
Create a Home Valuation Report for This Property
The Home Valuation Report is an in-depth analysis detailing your home's value as well as a comparison with similar homes in the area
Home Values in the Area
Average Home Value in this Area
Purchase History
| Date | Buyer | Sale Price | Title Company |
|---|---|---|---|
| Lellig Robert | $86,000 | None Listed On Document |
Source: Public Records
Mortgage History
| Date | Status | Borrower | Loan Amount |
|---|---|---|---|
| Open | Lellig Robert | $87,849 |
Source: Public Records
Tax History Compared to Growth
Tax History
| Year | Tax Paid | Tax Assessment Tax Assessment Total Assessment is a certain percentage of the fair market value that is determined by local assessors to be the total taxable value of land and additions on the property. | Land | Improvement |
|---|---|---|---|---|
| 2025 | $912 | $89,000 | $16,810 | $72,190 |
| 2024 | $912 | $77,910 | $15,010 | $62,900 |
| 2023 | $1,488 | $76,590 | $15,010 | $61,580 |
| 2022 | $1,278 | $60,710 | $11,920 | $48,790 |
| 2021 | $1,278 | $60,710 | $11,920 | $48,790 |
| 2020 | $1,278 | $56,210 | $10,830 | $45,380 |
| 2019 | $1,278 | $56,210 | $10,830 | $45,380 |
| 2018 | $1,226 | $55,490 | $10,830 | $44,660 |
| 2017 | $1,216 | $55,490 | $10,830 | $44,660 |
| 2016 | $1,198 | $54,310 | $6,450 | $47,860 |
| 2015 | $1,198 | $54,310 | $6,450 | $47,860 |
| 2014 | $1,220 | $54,310 | $6,450 | $47,860 |
Source: Public Records
Map
Nearby Homes