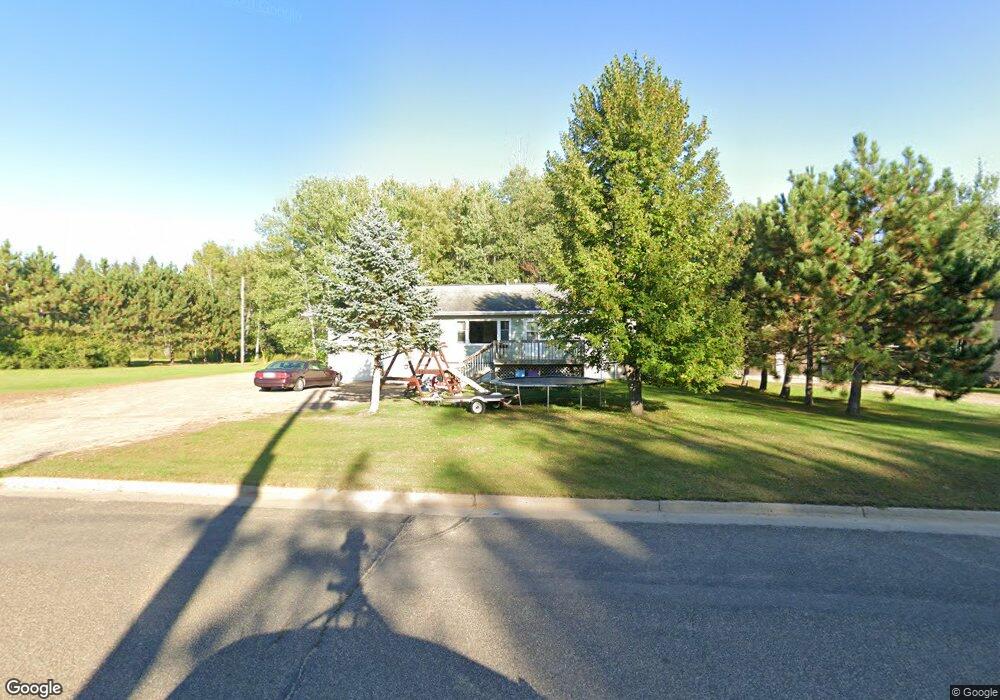
713 & 715 Beech St Brainerd, MN 56401
Estimated Value: $258,000 - $319,090
6
Beds
3
Baths
1,328
Sq Ft
$216/Sq Ft
Est. Value
About This Home
This home is located at 713 & 715 Beech St, Brainerd, MN 56401 and is currently estimated at $286,773, approximately $215 per square foot. 713 & 715 Beech St is a home located in Crow Wing County with nearby schools including Harrison Elementary School, Forestview Middle School, and Brainerd Senior High School.
Ownership History
Date
Name
Owned For
Owner Type
Purchase Details
Closed on
Jun 28, 2024
Sold by
Jk Assets Llc
Bought by
Kavland Properties Llc
Current Estimated Value
Home Financials for this Owner
Home Financials are based on the most recent Mortgage that was taken out on this home.
Original Mortgage
$225,000
Outstanding Balance
$179,321
Interest Rate
7.03%
Mortgage Type
New Conventional
Estimated Equity
$107,452
Purchase Details
Closed on
May 12, 2017
Sold by
Straight Linda Linda
Home Financials for this Owner
Home Financials are based on the most recent Mortgage that was taken out on this home.
Original Mortgage
$152,000
Interest Rate
4.14%
Create a Home Valuation Report for This Property
The Home Valuation Report is an in-depth analysis detailing your home's value as well as a comparison with similar homes in the area
Home Values in the Area
Average Home Value in this Area
Purchase History
| Date | Buyer | Sale Price | Title Company |
|---|---|---|---|
| Kavland Properties Llc | $250,000 | Elite Title & Escrow | |
| -- | $154,000 | -- |
Source: Public Records
Mortgage History
| Date | Status | Borrower | Loan Amount |
|---|---|---|---|
| Open | Kavland Properties Llc | $225,000 | |
| Previous Owner | -- | $152,000 |
Source: Public Records
Tax History Compared to Growth
Tax History
| Year | Tax Paid | Tax Assessment Tax Assessment Total Assessment is a certain percentage of the fair market value that is determined by local assessors to be the total taxable value of land and additions on the property. | Land | Improvement |
|---|---|---|---|---|
| 2025 | $3,540 | $264,500 | $64,800 | $199,700 |
| 2024 | $3,540 | $269,700 | $60,100 | $209,600 |
| 2023 | $3,482 | $279,800 | $54,000 | $225,800 |
| 2022 | $3,192 | $247,600 | $47,600 | $200,000 |
| 2021 | $3,374 | $181,100 | $41,300 | $139,800 |
| 2020 | $3,334 | $183,300 | $42,400 | $140,900 |
| 2019 | $3,336 | $172,900 | $42,400 | $130,500 |
| 2018 | $3,012 | $171,300 | $42,500 | $128,800 |
| 2017 | $2,868 | $164,100 | $42,500 | $121,600 |
| 2016 | $2,110 | $115,100 | $37,400 | $77,700 |
| 2015 | $1,982 | $108,900 | $32,400 | $76,500 |
| 2014 | $936 | $110,400 | $31,100 | $79,300 |
Source: Public Records
Map
Nearby Homes