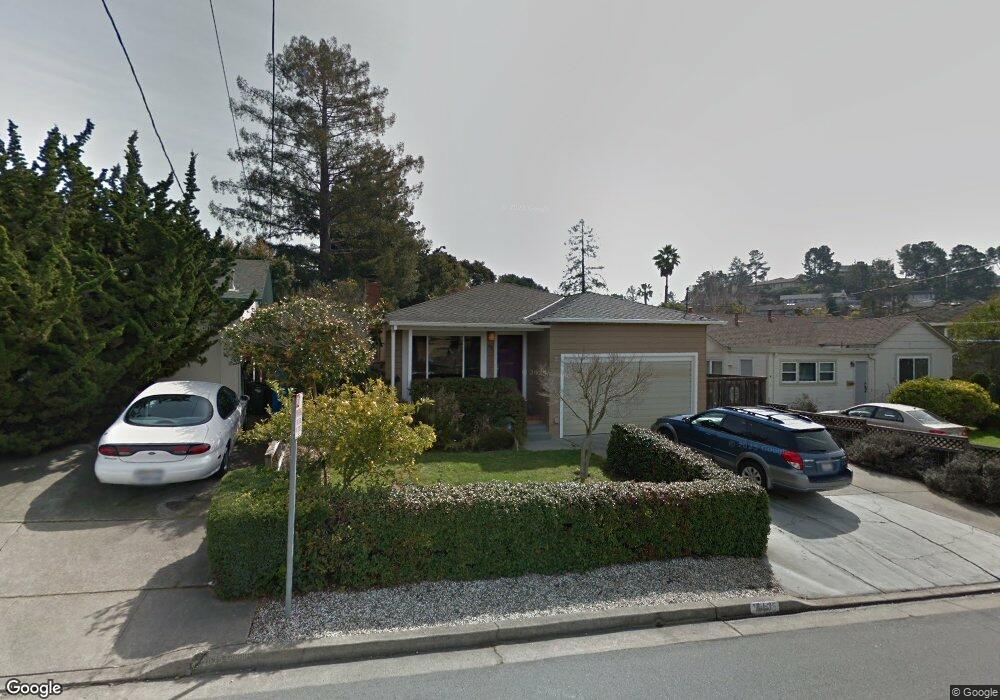
713 Dartmouth Ave San Carlos, CA 94070
Cordes NeighborhoodEstimated Value: $1,911,131 - $2,296,000
2
Beds
1
Bath
1,260
Sq Ft
$1,673/Sq Ft
Est. Value
About This Home
This home is located at 713 Dartmouth Ave, San Carlos, CA 94070 and is currently estimated at $2,108,533, approximately $1,673 per square foot. 713 Dartmouth Ave is a home located in San Mateo County with nearby schools including Arundel Elementary School, Tierra Linda Middle School, and Carlmont High School.
Ownership History
Date
Name
Owned For
Owner Type
Purchase Details
Closed on
Feb 25, 2003
Sold by
Hurt W Bailey and Manzi Beth
Bought by
Magie Douglas E and Magie Pamela B
Current Estimated Value
Home Financials for this Owner
Home Financials are based on the most recent Mortgage that was taken out on this home.
Original Mortgage
$524,400
Outstanding Balance
$224,945
Interest Rate
5.85%
Estimated Equity
$1,883,588
Purchase Details
Closed on
Oct 22, 1996
Sold by
Byington Jenifer F
Bought by
Hurt W Bailey and Manzi Beth
Home Financials for this Owner
Home Financials are based on the most recent Mortgage that was taken out on this home.
Original Mortgage
$276,800
Interest Rate
5.5%
Purchase Details
Closed on
Jul 22, 1994
Sold by
Leighton Mary Louise
Bought by
Byington Guy and Byington Jennifer Fox
Home Financials for this Owner
Home Financials are based on the most recent Mortgage that was taken out on this home.
Original Mortgage
$244,000
Interest Rate
8.25%
Create a Home Valuation Report for This Property
The Home Valuation Report is an in-depth analysis detailing your home's value as well as a comparison with similar homes in the area
Home Values in the Area
Average Home Value in this Area
Purchase History
| Date | Buyer | Sale Price | Title Company |
|---|---|---|---|
| Magie Douglas E | $655,500 | First American Title Company | |
| Hurt W Bailey | $346,000 | Old Republic Title Company | |
| Byington Guy | $305,000 | Old Republic Title Co |
Source: Public Records
Mortgage History
| Date | Status | Borrower | Loan Amount |
|---|---|---|---|
| Open | Magie Douglas E | $524,400 | |
| Previous Owner | Hurt W Bailey | $276,800 | |
| Previous Owner | Byington Guy | $244,000 | |
| Closed | Magie Douglas E | $98,325 |
Source: Public Records
Tax History Compared to Growth
Tax History
| Year | Tax Paid | Tax Assessment Tax Assessment Total Assessment is a certain percentage of the fair market value that is determined by local assessors to be the total taxable value of land and additions on the property. | Land | Improvement |
|---|---|---|---|---|
| 2025 | $12,348 | $949,368 | $474,684 | $474,684 |
| 2023 | $12,348 | $912,504 | $456,252 | $456,252 |
| 2022 | $11,633 | $894,612 | $447,306 | $447,306 |
| 2021 | $11,463 | $877,072 | $438,536 | $438,536 |
| 2020 | $11,330 | $868,080 | $434,040 | $434,040 |
| 2019 | $11,110 | $851,060 | $425,530 | $425,530 |
| 2018 | $10,817 | $834,374 | $417,187 | $417,187 |
| 2017 | $10,670 | $818,014 | $409,007 | $409,007 |
| 2016 | $10,441 | $801,976 | $400,988 | $400,988 |
| 2015 | $10,406 | $789,930 | $394,965 | $394,965 |
| 2014 | $10,085 | $774,458 | $387,229 | $387,229 |
Source: Public Records
Map
Nearby Homes
- 90 Gateway Ct
- 46 Arch Ln
- 38 Sequoia Ct
- 1315 Alameda de Las Pulgas
- 1220 Chula Vista Dr
- 1715 El Verano Way
- 241 Shelford Ave
- 28 Kirkwood Way
- 140 Northam Ave
- 1630 Courtland Rd
- 108 Beverly Dr
- 58 Hillcrest Rd
- 141 Hillcrest Rd
- 0 Devonshire Blvd
- 1597 Molitor Rd
- 222 Oakley Ave
- 000 Devonshire Blvd
- 901 Holly Rd
- 1961 Alden St
- 21 Highland Ave
- 715 Dartmouth Ave
- 711 Dartmouth Ave
- 679 Wellington Dr
- 725 Dartmouth Ave
- 671 Wellington Dr
- 733 Dartmouth Ave
- 663 Wellington Dr
- 712 Dartmouth Ave
- 718 Dartmouth Ave
- 2702 San Carlos Ave
- 706 Dartmouth Ave
- 686 Wellington Dr
- 724 Dartmouth Ave
- 739 Dartmouth Ave
- 655 Wellington Dr
- 688 Dartmouth Ave
- 2708 San Carlos Ave
- 730 Dartmouth Ave
- 680 Dartmouth Ave
- 678 Wellington Dr