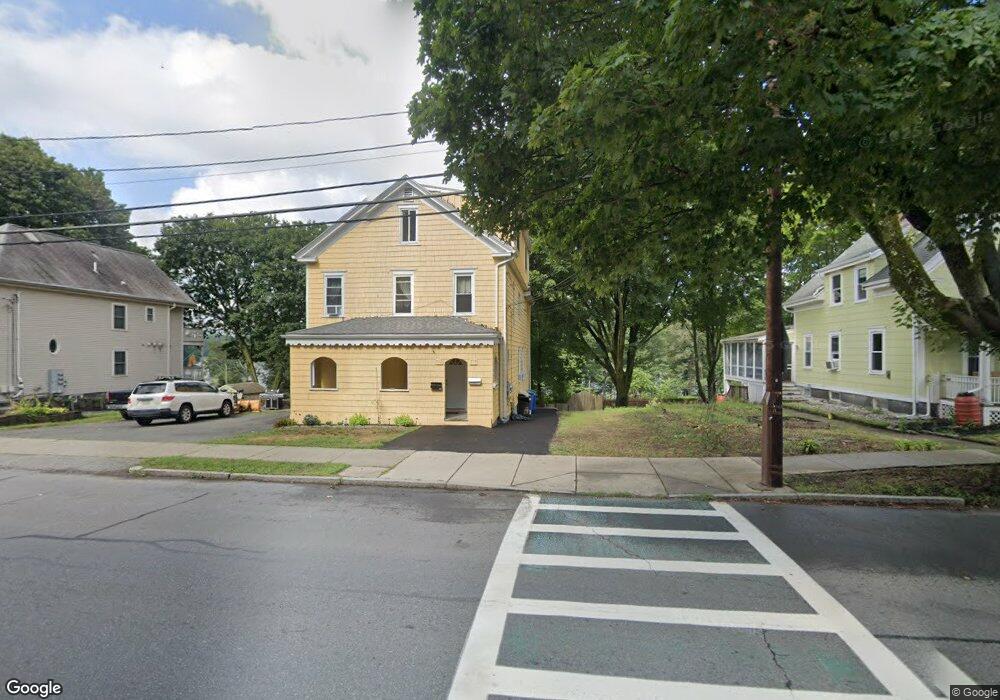
713 Main St Unit 715 Wakefield, MA 01880
East Side NeighborhoodEstimated Value: $825,000 - $1,072,000
6
Beds
4
Baths
3,456
Sq Ft
$275/Sq Ft
Est. Value
About This Home
This home is located at 713 Main St Unit 715, Wakefield, MA 01880 and is currently estimated at $948,716, approximately $274 per square foot. 713 Main St Unit 715 is a home located in Middlesex County with nearby schools including Wakefield Memorial High School, St Joseph School, and St. Patrick Elementary School.
Ownership History
Date
Name
Owned For
Owner Type
Purchase Details
Closed on
Jul 8, 1987
Sold by
Parlatore John A
Bought by
Maroufi Magid S
Current Estimated Value
Home Financials for this Owner
Home Financials are based on the most recent Mortgage that was taken out on this home.
Original Mortgage
$137,600
Interest Rate
10.71%
Mortgage Type
Purchase Money Mortgage
Create a Home Valuation Report for This Property
The Home Valuation Report is an in-depth analysis detailing your home's value as well as a comparison with similar homes in the area
Home Values in the Area
Average Home Value in this Area
Purchase History
| Date | Buyer | Sale Price | Title Company |
|---|---|---|---|
| Maroufi Magid S | $183,500 | -- |
Source: Public Records
Mortgage History
| Date | Status | Borrower | Loan Amount |
|---|---|---|---|
| Closed | Maroufi Magid S | $137,600 |
Source: Public Records
Tax History Compared to Growth
Tax History
| Year | Tax Paid | Tax Assessment Tax Assessment Total Assessment is a certain percentage of the fair market value that is determined by local assessors to be the total taxable value of land and additions on the property. | Land | Improvement |
|---|---|---|---|---|
| 2025 | $9,688 | $853,600 | $359,000 | $494,600 |
| 2024 | $9,509 | $845,200 | $355,400 | $489,800 |
| 2023 | $9,006 | $767,800 | $322,900 | $444,900 |
| 2022 | $8,678 | $704,400 | $296,200 | $408,200 |
| 2021 | $7,853 | $616,900 | $267,400 | $349,500 |
| 2020 | $7,530 | $589,700 | $255,600 | $334,100 |
| 2019 | $7,136 | $556,200 | $241,100 | $315,100 |
| 2018 | $6,779 | $523,500 | $226,900 | $296,600 |
| 2017 | $6,591 | $505,800 | $219,200 | $286,600 |
| 2016 | $6,193 | $459,100 | $215,500 | $243,600 |
| 2015 | $5,900 | $437,700 | $205,400 | $232,300 |
| 2014 | $5,484 | $429,100 | $201,400 | $227,700 |
Source: Public Records
Map
Nearby Homes
- 706 Main St Unit A
- 18 Franklin St
- 6 Salisbury Rd
- 134 Nahant St Unit B
- 7 Coolidge Rd
- 69 Foundry St Unit 314
- 62 Foundry St Unit 414
- 62 Foundry St Unit 413
- 62 Foundry St Unit 216
- 62 Foundry St Unit 208
- 62 Foundry St Unit 406
- 62 Foundry St Unit 312
- 62 Foundry St Unit 310
- 62 Foundry St Unit 313
- 22 Jefferson Rd
- 22 Armory St
- 18 Crosby Rd
- 7 Holland Rd
- 70 Meriam St
- 5 Bateman Ct Unit 5