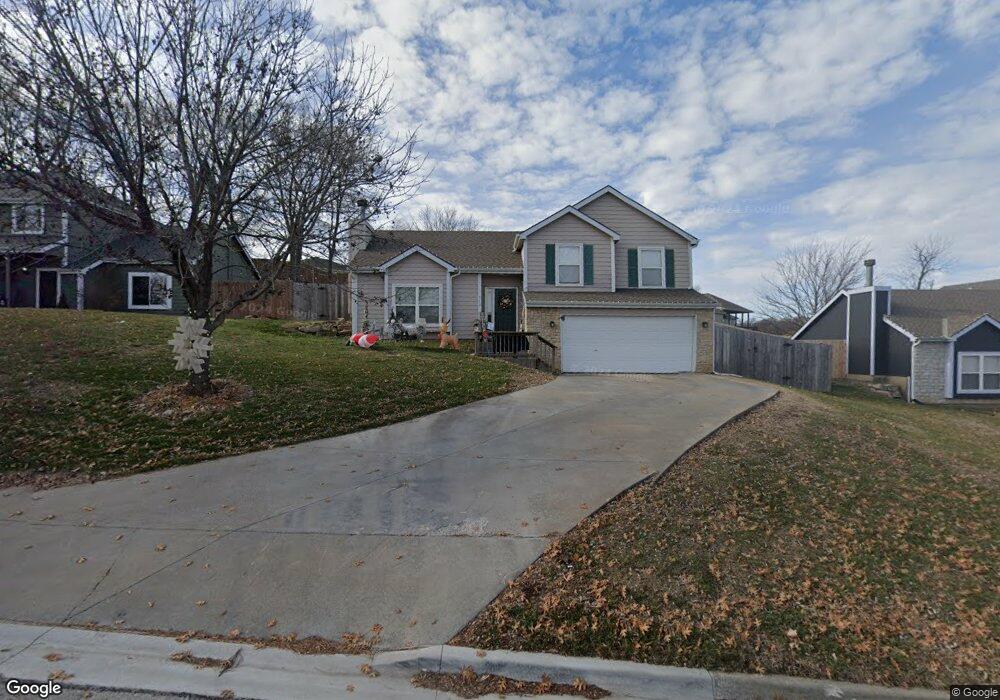
713 N Eagle Pass Dr Lawrence, KS 66049
Estimated Value: $325,000 - $368,000
4
Beds
3
Baths
1,576
Sq Ft
$222/Sq Ft
Est. Value
About This Home
This home is located at 713 N Eagle Pass Dr, Lawrence, KS 66049 and is currently estimated at $349,612, approximately $221 per square foot. 713 N Eagle Pass Dr is a home located in Douglas County with nearby schools including Deerfield Elementary School, West Middle School, and Lawrence Free State High School.
Ownership History
Date
Name
Owned For
Owner Type
Purchase Details
Closed on
Aug 26, 2020
Sold by
Location Properties Lc
Bought by
Maloney Nicholas and Maloney Skyelar
Current Estimated Value
Home Financials for this Owner
Home Financials are based on the most recent Mortgage that was taken out on this home.
Original Mortgage
$235,653
Outstanding Balance
$209,126
Interest Rate
2.9%
Mortgage Type
FHA
Estimated Equity
$140,486
Purchase Details
Closed on
Jan 16, 2004
Sold by
Corron Builders Llc
Bought by
Hedges Bryan C and Hedges Laura P
Home Financials for this Owner
Home Financials are based on the most recent Mortgage that was taken out on this home.
Original Mortgage
$134,910
Interest Rate
5.79%
Mortgage Type
Purchase Money Mortgage
Purchase Details
Closed on
Mar 13, 2001
Sold by
North Stephens Lc
Bought by
Corron Builders Llc
Home Financials for this Owner
Home Financials are based on the most recent Mortgage that was taken out on this home.
Original Mortgage
$128,800
Interest Rate
5.9%
Mortgage Type
Construction
Create a Home Valuation Report for This Property
The Home Valuation Report is an in-depth analysis detailing your home's value as well as a comparison with similar homes in the area
Home Values in the Area
Average Home Value in this Area
Purchase History
| Date | Buyer | Sale Price | Title Company |
|---|---|---|---|
| Maloney Nicholas | -- | Security 1St Title | |
| Hedges Bryan C | -- | Capital Title Ins Co Lc | |
| Corron Builders Llc | -- | -- |
Source: Public Records
Mortgage History
| Date | Status | Borrower | Loan Amount |
|---|---|---|---|
| Open | Maloney Nicholas | $235,653 | |
| Previous Owner | Hedges Bryan C | $134,910 | |
| Previous Owner | Corron Builders Llc | $128,800 | |
| Closed | Corron Builders Llc | $17,160 |
Source: Public Records
Tax History Compared to Growth
Tax History
| Year | Tax Paid | Tax Assessment Tax Assessment Total Assessment is a certain percentage of the fair market value that is determined by local assessors to be the total taxable value of land and additions on the property. | Land | Improvement |
|---|---|---|---|---|
| 2025 | $4,648 | $37,594 | $7,475 | $30,119 |
| 2024 | $4,624 | $37,387 | $7,475 | $29,912 |
| 2023 | $4,448 | $34,661 | $6,900 | $27,761 |
| 2022 | $4,148 | $32,120 | $6,900 | $25,220 |
| 2021 | $3,681 | $27,600 | $5,980 | $21,620 |
| 2020 | $3,050 | $23,039 | $5,980 | $17,059 |
| 2019 | $2,899 | $21,942 | $5,060 | $16,882 |
| 2018 | $2,801 | $21,057 | $4,600 | $16,457 |
| 2017 | $2,780 | $20,666 | $4,600 | $16,066 |
| 2016 | $2,691 | $20,896 | $4,600 | $16,296 |
| 2015 | -- | $20,746 | $4,600 | $16,146 |
| 2014 | -- | $20,171 | $4,600 | $15,571 |
Source: Public Records
Map
Nearby Homes
- 826 N Field Stone Dr
- 3413 Sweetgrass Ct
- 3512 Prairie Clover Ct
- 3508 Prairie Clover Ct
- 732 N Blazing Star Dr
- 420 Winnie Way
- 504 N Monterey Way
- 406 N Olivia Ave
- 3112 Sherwood Dr
- Lot 2 Peterson Rd
- 3708 Buck Brush Ct
- Lot 1 Fall Creek Rd
- Lot 5 Weatherhill Cir
- 229 Deerfield Ln
- Lot 1 N Running Ridge Rd
- Lot 6 Weatherhill Cir
- 110 Glenview Dr
- 145 N Fall Creek Dr
- 141 N Fall Creek Dr
- 528 Durham Ct
- 717 N Eagle Pass Dr
- 709 N Eagle Pass Dr
- 734 N Wild Plum Ct
- 705 N Eagle Pass Dr
- 721 N Eagle Pass Dr
- 735 N Wild Plum Ct
- 626 N Wren Dr
- 712 N Eagle Pass Dr
- 716 N Eagle Pass Dr
- 635 N Daylily Dr
- 701 N Eagle Pass Dr
- 704 N Eagle Pass Dr
- 720 N Eagle Pass Dr
- 731 N Wild Plum Ct
- 622 N Wren Dr
- 613 N Eagle Pass Dr
- 700 N Eagle Pass Dr
- 631 N Daylily Dr
- 3529 Sweetgrass Ct
- 3531 Sweetgrass Ct