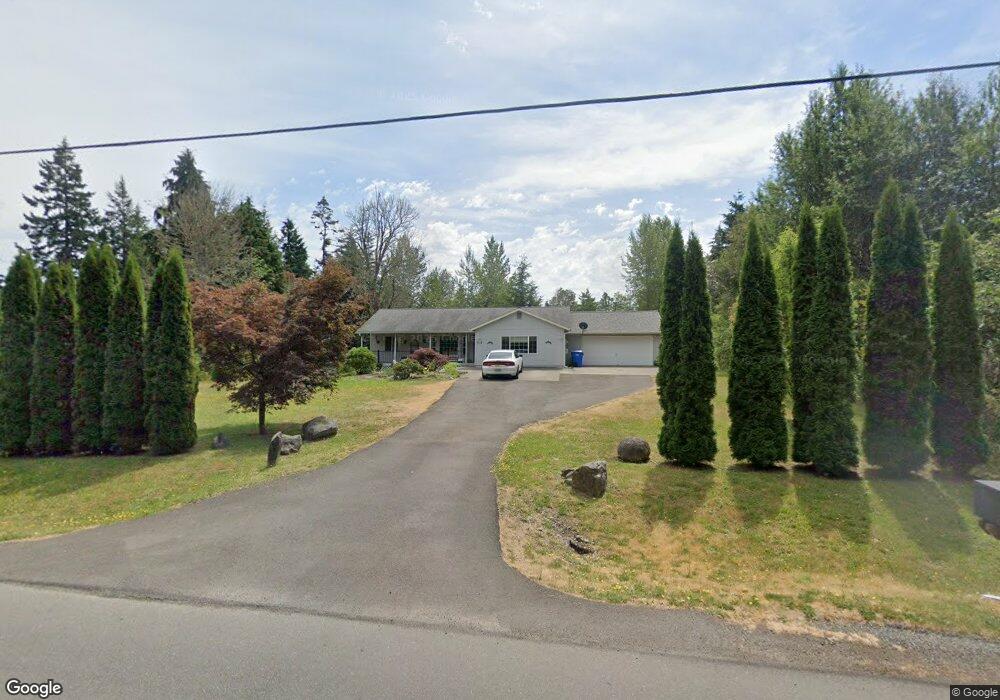
713 Tipsoo Loop S Rainier, WA 98576
Estimated Value: $428,000 - $497,000
2
Beds
2
Baths
1,167
Sq Ft
$392/Sq Ft
Est. Value
About This Home
This home is located at 713 Tipsoo Loop S, Rainier, WA 98576 and is currently estimated at $457,290, approximately $391 per square foot. 713 Tipsoo Loop S is a home located in Thurston County with nearby schools including Rainier Elementary School, Rainier Middle School, and Rainier Senior High School.
Ownership History
Date
Name
Owned For
Owner Type
Purchase Details
Closed on
Dec 5, 2002
Sold by
Bushman Roberta A and Watt Roberta A
Bought by
Bushman Dean N and Bushman Roberta A
Current Estimated Value
Home Financials for this Owner
Home Financials are based on the most recent Mortgage that was taken out on this home.
Original Mortgage
$99,787
Interest Rate
6.06%
Mortgage Type
VA
Purchase Details
Closed on
Mar 25, 1998
Sold by
Rainier General Development Inc
Bought by
Watt Roberta A
Home Financials for this Owner
Home Financials are based on the most recent Mortgage that was taken out on this home.
Original Mortgage
$101,898
Interest Rate
7.06%
Mortgage Type
VA
Purchase Details
Closed on
Oct 7, 1997
Sold by
Treiber Shirley A and Berikoff Shirley A Treiber
Bought by
Rainier General Development
Create a Home Valuation Report for This Property
The Home Valuation Report is an in-depth analysis detailing your home's value as well as a comparison with similar homes in the area
Home Values in the Area
Average Home Value in this Area
Purchase History
| Date | Buyer | Sale Price | Title Company |
|---|---|---|---|
| Bushman Dean N | -- | Thurston County Title | |
| Watt Roberta A | $99,896 | Thurston County Title Co | |
| Rainier General Development | -- | Thurston County Title Co |
Source: Public Records
Mortgage History
| Date | Status | Borrower | Loan Amount |
|---|---|---|---|
| Closed | Bushman Dean N | $99,787 | |
| Closed | Watt Roberta A | $101,898 |
Source: Public Records
Tax History
| Year | Tax Paid | Tax Assessment Tax Assessment Total Assessment is a certain percentage of the fair market value that is determined by local assessors to be the total taxable value of land and additions on the property. | Land | Improvement |
|---|---|---|---|---|
| 2025 | $3,768 | $422,500 | $136,100 | $286,400 |
| 2024 | $3,768 | $392,200 | $134,300 | $257,900 |
| 2023 | $3,768 | $402,200 | $126,600 | $275,600 |
| 2022 | $3,661 | $393,700 | $89,600 | $304,100 |
| 2021 | $2,934 | $355,200 | $105,800 | $249,400 |
| 2020 | $2,576 | $280,000 | $87,000 | $193,000 |
| 2019 | $2,294 | $222,700 | $57,700 | $165,000 |
| 2018 | $2,518 | $199,200 | $49,800 | $149,400 |
| 2017 | $2,319 | $190,200 | $41,400 | $148,800 |
| 2016 | $2,361 | $183,700 | $53,200 | $130,500 |
| 2014 | -- | $178,500 | $53,200 | $125,300 |
Source: Public Records
Map
Nearby Homes
- 605 Hubbard Rd SE
- 733 Tipsoo Loop S
- 309 Binghampton St SE
- 955 Tipsoo Loop N
- 302 Centre St N
- 414 Easy St SE
- 101 Murphy Ln S
- 108 2nd St SE
- 308 Easy St SE
- 108 Centre St S
- 701 Myers St SE
- 810 Cody St SE
- 823 Tipsoo Loop S
- 604 Nieland Loop SE
- 132 xx Algyer Rd SE
- 210 Country Estates Dr W
- 14319 123rd Ave SE
- 14532 130th Ln SE
- 14913 Champion Estates Dr SE
- 11635 Hobby St SE
- 711 Tipsoo Loop S
- 709 Tipsoo Loop S
- 428 Volesky Dr SE
- 418 Volesky Dr SE
- 416 Volesky Dr SE
- 524 Karen Ct SE
- 420 Volesky Dr SE
- 522 Karen Ct SE
- 414 Volesky Dr SE
- 714 Tipsoo Loop S
- 719 Tipsoo Loop S Unit A
- 719 Tipsoo Loop S Unit A
- 719 Tipsoo Loop S Unit B
- 719 Tipsoo Loop S
- 412 Volesky Dr SE
- 716A Tipsoo Loop S
- 527 Karen Ct SE
- 424 Volesky Dr SE
- 525 Karen Ct SE
- 712 Tipsoo Loop S
Your Personal Tour Guide
Ask me questions while you tour the home.