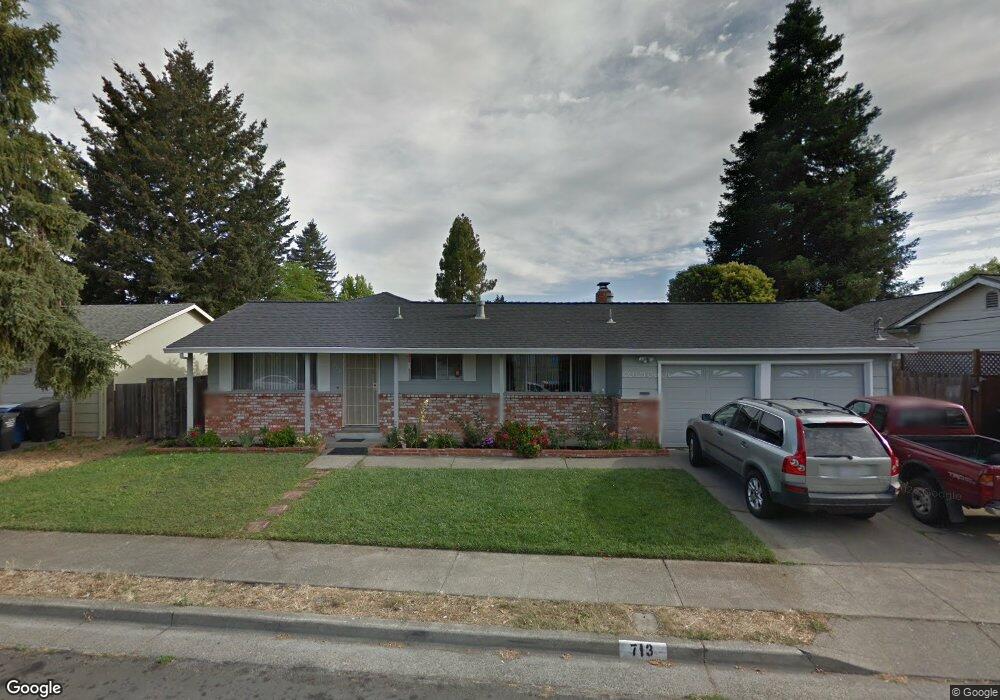
713 Willrush St Santa Rosa, CA 95401
Estimated Value: $558,000 - $615,000
3
Beds
2
Baths
1,238
Sq Ft
$467/Sq Ft
Est. Value
About This Home
This home is located at 713 Willrush St, Santa Rosa, CA 95401 and is currently estimated at $577,913, approximately $466 per square foot. 713 Willrush St is a home located in Sonoma County with nearby schools including Abraham Lincoln Elementary School, Santa Rosa Middle School, and Santa Rosa High School.
Ownership History
Date
Name
Owned For
Owner Type
Purchase Details
Closed on
Feb 15, 2017
Sold by
Delopez Victoria Romaniz and De Lopez Victoria Romaiz
Bought by
Delopez Victoria Romaniz and Perea Prospero Lopez
Current Estimated Value
Home Financials for this Owner
Home Financials are based on the most recent Mortgage that was taken out on this home.
Original Mortgage
$269,637
Outstanding Balance
$221,156
Interest Rate
3.87%
Mortgage Type
FHA
Estimated Equity
$356,757
Purchase Details
Closed on
Oct 28, 2015
Sold by
Romaniz Lorenzo
Bought by
Romaniz Lorenzo and Delopez Victoria Romaiz
Purchase Details
Closed on
Feb 21, 2014
Sold by
Patane Anthony and Patane Beverly
Bought by
Romaniz Lorenzo
Home Financials for this Owner
Home Financials are based on the most recent Mortgage that was taken out on this home.
Original Mortgage
$271,700
Interest Rate
4.34%
Mortgage Type
New Conventional
Purchase Details
Closed on
Jul 6, 2000
Sold by
Patane Anthony
Bought by
Patane Anthony and Patane Beverly
Purchase Details
Closed on
Feb 8, 2000
Sold by
Patane Esther
Bought by
Patane Anthony
Create a Home Valuation Report for This Property
The Home Valuation Report is an in-depth analysis detailing your home's value as well as a comparison with similar homes in the area
Purchase History
| Date | Buyer | Sale Price | Title Company |
|---|---|---|---|
| Delopez Victoria Romaniz | -- | First American Title Company | |
| Delopez Victoria Romaniz | -- | First American Title Company | |
| Romaniz Lorenzo | $243,636 | None Available | |
| Romaniz Lorenzo | $286,000 | First American Title Company | |
| Patane Anthony | -- | -- | |
| Patane Anthony | -- | -- |
Source: Public Records
Mortgage History
| Date | Status | Borrower | Loan Amount |
|---|---|---|---|
| Open | Delopez Victoria Romaniz | $269,637 | |
| Previous Owner | Romaniz Lorenzo | $271,700 |
Source: Public Records
Tax History
| Year | Tax Paid | Tax Assessment Tax Assessment Total Assessment is a certain percentage of the fair market value that is determined by local assessors to be the total taxable value of land and additions on the property. | Land | Improvement |
|---|---|---|---|---|
| 2025 | $5,456 | $482,796 | $193,233 | $289,563 |
| 2024 | $5,456 | $473,331 | $189,445 | $283,886 |
| 2023 | $5,456 | $464,051 | $185,731 | $278,320 |
| 2022 | $5,039 | $454,953 | $182,090 | $272,863 |
| 2021 | $4,979 | $446,033 | $178,520 | $267,513 |
| 2020 | $4,967 | $441,460 | $176,690 | $264,770 |
| 2019 | $4,942 | $432,805 | $173,226 | $259,579 |
| 2018 | $4,915 | $424,320 | $169,830 | $254,490 |
| 2017 | $3,517 | $302,083 | $120,939 | $181,144 |
| 2016 | $3,488 | $296,161 | $118,568 | $177,593 |
| 2015 | $3,383 | $291,713 | $116,787 | $174,926 |
| 2014 | $1,537 | $136,959 | $47,773 | $89,186 |
Source: Public Records
Map
Nearby Homes
- 611 Willrush St
- 158 N Dutton Ave Unit 4
- 303 Boyce St
- 1555 W 3rd St
- 786 Simpson Place
- 1035 Maxwell Dr
- 713 Blair Place
- 717 Blair Place
- 595 N Dutton Ave
- 300 Stony Point Rd Unit 126
- 300 Stony Point Rd Unit 139
- 724 Agnew Place
- 1702 Glenbrook Dr Unit D
- 588 Roseland Ave
- 77 Romani Ct
- 1708 Glenbrook Dr Unit F
- 62 Romani Ct
- 334 Brockhurst Dr
- 1127 Cleveland Ave
- 930 Morgan St Unit 3
- 619 Willrush St
- 714 Trowbridge St
- 618 Trowbridge St
- 718 Trowbridge St
- 712 Willrush St
- 615 Willrush St
- 721 Willrush St
- 716 Willrush St
- 622 Willrush St
- 614 Trowbridge St
- 722 Trowbridge St
- 618 Willrush St
- 711 Hewett St
- 715 Hewett St
- 610 Trowbridge St
- 713 Trowbridge St
- 709 Trowbridge St
- 621 Hewett St
- 717 Trowbridge St
- 550 Link Ln
Your Personal Tour Guide
Ask me questions while you tour the home.