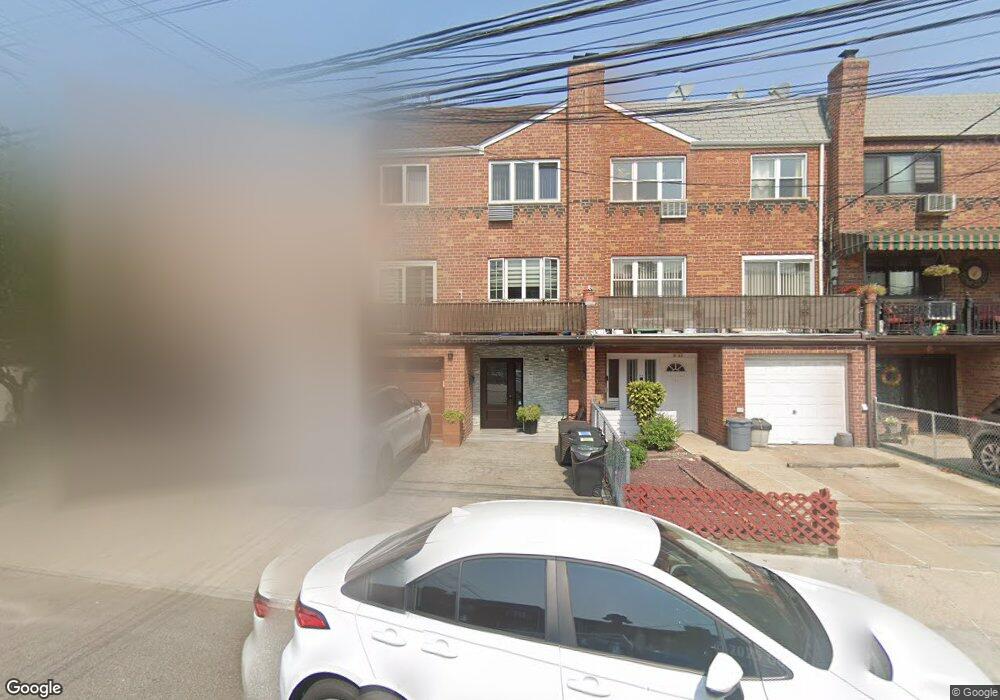
7131 58th Rd Maspeth, NY 11378
Maspeth NeighborhoodEstimated Value: $1,384,000 - $1,549,000
About This Home
This home is located at 7131 58th Rd, Maspeth, NY 11378 and is currently estimated at $1,475,333, approximately $560 per square foot. 7131 58th Rd is a home located in Queens County with nearby schools including Ps 58 School Of Heroes, IS 73 - The Frank Sansivieri School, and Grover Cleveland High School.
Ownership History
We collect this data history from publicly available records. To have your information removed, we recommend requesting removal directly through your county’s website.
Purchase Details
Home Financials for this Owner
Home Financials are based on the most recent Mortgage that was taken out on this home.Purchase Details
Home Financials for this Owner
Home Financials are based on the most recent Mortgage that was taken out on this home.Purchase Details
Home Values in the Area
Average Home Value in this Area
Purchase History
We collect this data history from publicly available records. To have your information removed, we recommend requesting removal directly through your county’s website.
| Date | Buyer | Sale Price | Title Company |
|---|---|---|---|
| -- | -- | ||
| $707,000 | -- | ||
| -- | -- |
Mortgage History
We collect this data history from publicly available records. To have your information removed, we recommend requesting removal directly through your county’s website.
| Date | Status | Borrower | Loan Amount |
|---|---|---|---|
| Open | $12,493 | ||
| Previous Owner | $530,000 |
Tax History
We collect this data history from publicly available records. To have your information removed, we recommend requesting removal directly through your county’s website.
| Year | Tax Paid | Tax Assessment Tax Assessment Total Assessment is a certain percentage of the fair market value that is determined by local assessors to be the total taxable value of land and additions on the property. | Land | Improvement |
|---|---|---|---|---|
| 2026 | $12,248 | $64,385 | $9,252 | $55,133 |
| 2025 | $11,542 | $62,400 | $9,890 | $52,510 |
| 2024 | $11,554 | $58,868 | $10,382 | $48,486 |
| 2023 | $10,873 | $55,537 | $8,745 | $46,792 |
| 2022 | $10,800 | $77,640 | $11,640 | $66,000 |
| 2021 | $10,995 | $73,920 | $11,640 | $62,280 |
| 2020 | $10,711 | $78,480 | $11,640 | $66,840 |
| 2019 | $9,969 | $78,240 | $11,640 | $66,600 |
| 2018 | $9,137 | $46,281 | $8,185 | $38,096 |
| 2017 | $9,135 | $46,281 | $10,273 | $36,008 |
| 2016 | $8,628 | $46,281 | $10,273 | $36,008 |
| 2015 | $5,266 | $43,333 | $10,492 | $32,841 |
| 2014 | $5,266 | $40,881 | $11,877 | $29,004 |
Map
- 7159 58th Rd
- 72-20 Caldwell Ave
- 59-30 71st St
- 7039 57th Dr
- 69-91 Caldwell Ave
- 74-09 58th Ave
- 59-29 70th St
- 69-68 57th Dr
- 5752 75th St
- 69-60 Caldwell Ave
- 6951 Caldwell Ave
- 5813 69th Place
- 72-17 Grand Ave Unit DEVSITE
- 70-09 Grand Ave
- 70-07 Grand Ave
- 5441 71st St
- 72-35 Grand Ave
- 5936 69th Place
- 6925 59th Rd
- 5958 69th Place
Ask me questions while you tour the home.