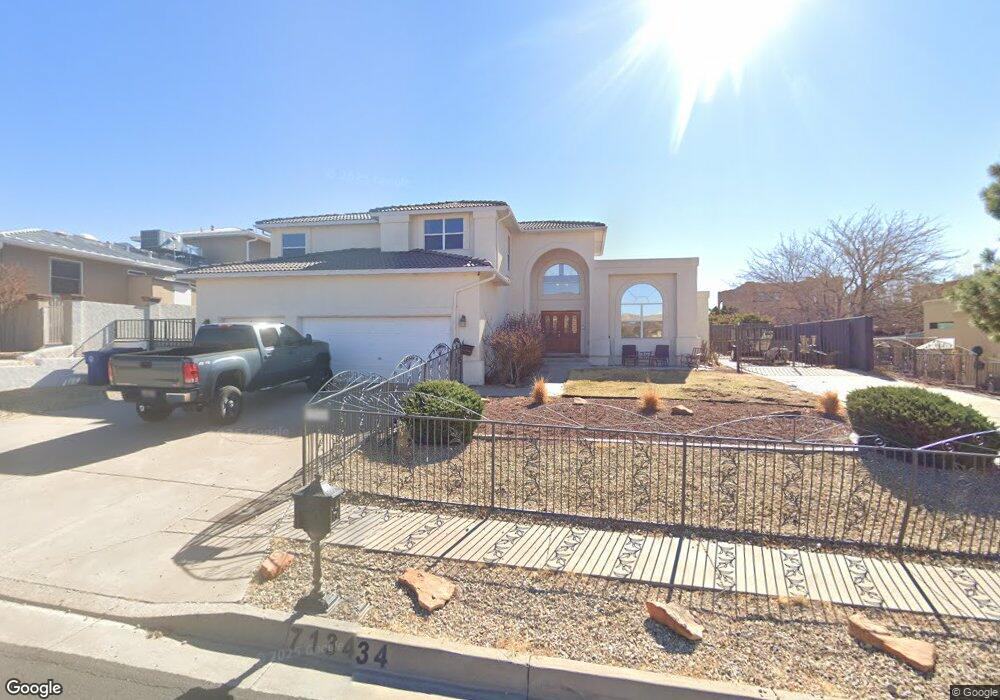
7134 Dodge Trail NW Albuquerque, NM 87120
Taylor Ranch NeighborhoodEstimated Value: $448,000 - $578,000
3
Beds
3
Baths
2,637
Sq Ft
$197/Sq Ft
Est. Value
About This Home
This home is located at 7134 Dodge Trail NW, Albuquerque, NM 87120 and is currently estimated at $520,512, approximately $197 per square foot. 7134 Dodge Trail NW is a home located in Bernalillo County with nearby schools including Marie M. Hughes Elementary School, L.B. Johnson Middle School, and Volcano Vista High School.
Ownership History
Date
Name
Owned For
Owner Type
Purchase Details
Closed on
Dec 21, 2023
Sold by
Barela Dominic Dominic Dominic
Bought by
Dominic Barela Trust and Barela
Current Estimated Value
Purchase Details
Closed on
Mar 7, 2022
Sold by
Barela Dominic O
Bought by
Barela Dominic O
Home Financials for this Owner
Home Financials are based on the most recent Mortgage that was taken out on this home.
Original Mortgage
$215,000
Interest Rate
2.93%
Mortgage Type
New Conventional
Purchase Details
Closed on
Nov 10, 2010
Sold by
Cardosa Sandra
Bought by
Barela Dominic O and Boles Shannon
Home Financials for this Owner
Home Financials are based on the most recent Mortgage that was taken out on this home.
Original Mortgage
$267,399
Interest Rate
4.25%
Mortgage Type
FHA
Purchase Details
Closed on
Jun 28, 2005
Sold by
Garcia David J and Garcia Janet L
Bought by
Cardosa Richard and Cardosa Sandra
Create a Home Valuation Report for This Property
The Home Valuation Report is an in-depth analysis detailing your home's value as well as a comparison with similar homes in the area
Home Values in the Area
Average Home Value in this Area
Purchase History
| Date | Buyer | Sale Price | Title Company |
|---|---|---|---|
| Dominic Barela Trust | -- | None Listed On Document | |
| Barela Dominic O | -- | None Listed On Document | |
| Barela Dominic O | -- | Fidelity Natl Title Ins Co | |
| Cardosa Richard | -- | Rio Grande Title Company Inc |
Source: Public Records
Mortgage History
| Date | Status | Borrower | Loan Amount |
|---|---|---|---|
| Previous Owner | Barela Dominic O | $215,000 | |
| Previous Owner | Barela Dominic O | $267,399 |
Source: Public Records
Tax History Compared to Growth
Tax History
| Year | Tax Paid | Tax Assessment Tax Assessment Total Assessment is a certain percentage of the fair market value that is determined by local assessors to be the total taxable value of land and additions on the property. | Land | Improvement |
|---|---|---|---|---|
| 2025 | $4,523 | $110,411 | $27,456 | $82,955 |
| 2024 | $4,523 | $107,195 | $26,656 | $80,539 |
| 2023 | $4,447 | $104,073 | $25,880 | $78,193 |
| 2022 | $4,298 | $101,042 | $25,126 | $75,916 |
| 2021 | $4,153 | $98,100 | $24,395 | $73,705 |
| 2020 | $4,085 | $95,243 | $23,685 | $71,558 |
| 2019 | $3,965 | $92,469 | $22,995 | $69,474 |
| 2018 | $3,824 | $92,469 | $22,995 | $69,474 |
| 2017 | $3,707 | $89,776 | $22,325 | $67,451 |
| 2016 | $3,600 | $84,623 | $21,044 | $63,579 |
| 2015 | $82,158 | $82,158 | $20,431 | $61,727 |
| 2014 | $3,486 | $82,095 | $16,436 | $65,659 |
| 2013 | -- | $79,704 | $15,957 | $63,747 |
Source: Public Records
Map
Nearby Homes
- 7300 Target Ln NW
- 5404 Territorial Rd NW
- 5429 Gold Rush Dr NW
- 7413 Target Ln NW
- 6012 Open Sky Dr NW
- 5333 Roanoke Ave NW
- 5136 Roanoke Ave NW
- 6921 El Cajon Ct NW
- 6616 Meadow Lake Place NW
- 7557 Richmond Hill Rd NW
- 7532 Deerfield Rd NW
- 6116 Agate Ave NW
- 6412 Picardia Place NW
- 6304 Canavio Rd
- 7516 Wells Fargo Trail NW
- 6224 Camino Alto Ct NW
- 8213 Urraca St NW
- 7432 Primrose Dr NW
- 8011 Camino Alderete NW
- 8015 Camino Alderete
- 7130 Dodge Trail NW
- 7144 Dodge Trail NW
- 7135 Dodge Trail NW
- 7139 Dodge Trail NW
- 7213 Carson Trail NW
- 7124 Dodge Trail NW
- 7131 Dodge Trail NW
- 7217 Carson Trail NW
- 7210 Dodge Trail NW
- 7143 Dodge Trail NW
- 7209 Carson Trail NW
- 7127 Dodge Trail NW
- 7120 Dodge Trail NW
- 7203 Carson Trail NW
- 7123 Dodge Trail NW
- 7147 Dodge Trail NW
- 7205 Dodge Trail NW
- 7209 Dodge Trail NW
- 7213 Dodge Trail NW
- 7116 Dodge Trail NW