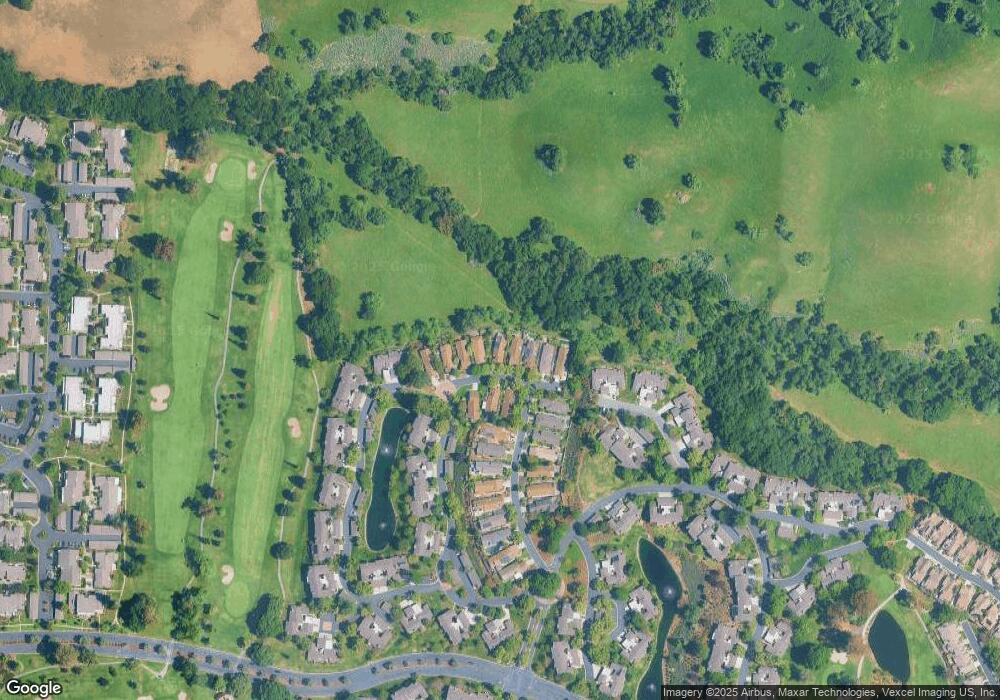
7139 Via Solana San Jose, CA 95135
The Villages NeighborhoodEstimated Value: $1,418,232 - $1,490,000
2
Beds
2
Baths
1,790
Sq Ft
$819/Sq Ft
Est. Value
About This Home
This home is located at 7139 Via Solana, San Jose, CA 95135 and is currently estimated at $1,465,558, approximately $818 per square foot. 7139 Via Solana is a home located in Santa Clara County with nearby schools including Tom Matsumoto Elementary School, Chaboya Middle School, and Silver Creek High School.
Ownership History
Date
Name
Owned For
Owner Type
Purchase Details
Closed on
Feb 22, 2018
Sold by
Cassidy Nancy K and Tchakerian Pamela J
Bought by
Cassidy Nancy K and Tchakerian Pamela J
Current Estimated Value
Purchase Details
Closed on
Jan 15, 2010
Sold by
Cassidy Nancy K
Bought by
Cassidy Nancy K and Trankle Pamela Jane
Home Financials for this Owner
Home Financials are based on the most recent Mortgage that was taken out on this home.
Original Mortgage
$248,000
Interest Rate
4.78%
Mortgage Type
New Conventional
Purchase Details
Closed on
Jul 18, 2009
Sold by
Cassidy Nancy K and Cassidy Nancy
Bought by
Cassidy Nancy K and Trankle Pamela Jane
Purchase Details
Closed on
Dec 18, 2003
Sold by
Cassidy Nancy and Trankle Pamela Jane
Bought by
Cassidy Nancy
Home Financials for this Owner
Home Financials are based on the most recent Mortgage that was taken out on this home.
Original Mortgage
$50,000
Interest Rate
5.97%
Mortgage Type
Credit Line Revolving
Purchase Details
Closed on
Aug 20, 2003
Sold by
Cassidy Nancy K
Bought by
Cassidy Nancy K and Trankle Pamela Jane
Purchase Details
Closed on
Oct 15, 2002
Sold by
Cassidy Nancy K
Bought by
Cassidy Nancy K and Trankle Pamela Jane
Home Financials for this Owner
Home Financials are based on the most recent Mortgage that was taken out on this home.
Original Mortgage
$274,000
Interest Rate
6.12%
Purchase Details
Closed on
Jun 16, 1999
Sold by
Cassidy Nancy K
Bought by
Cassidy Nancy K and Trankle Pamela Jane
Purchase Details
Closed on
Mar 31, 1998
Sold by
Mccutcheon Ruth E
Bought by
Mccutcheon Ruth E and Mccutcheon John M
Home Financials for this Owner
Home Financials are based on the most recent Mortgage that was taken out on this home.
Original Mortgage
$60,000
Interest Rate
7%
Create a Home Valuation Report for This Property
The Home Valuation Report is an in-depth analysis detailing your home's value as well as a comparison with similar homes in the area
Home Values in the Area
Average Home Value in this Area
Purchase History
| Date | Buyer | Sale Price | Title Company |
|---|---|---|---|
| Cassidy Nancy K | -- | None Available | |
| Cassidy Nancy K | -- | Old Republic Title Company | |
| Cassidy Nancy K | -- | Old Republic Title Company | |
| Cassidy Nancy K | -- | None Available | |
| Cassidy Nancy | -- | Fidelity National Title | |
| Cassidy Nancy K | -- | Alliance Title Company | |
| Cassidy Nancy K | -- | American Title Insurance Co | |
| Cassidy Nancy K | -- | American Title Insurance Co | |
| Cassidy Nancy K | -- | -- | |
| Mccutcheon Ruth E | -- | Financial Title Company | |
| Mccutcheon Ruth E | -- | Financial Title Company |
Source: Public Records
Mortgage History
| Date | Status | Borrower | Loan Amount |
|---|---|---|---|
| Closed | Cassidy Nancy K | $248,000 | |
| Closed | Cassidy Nancy | $50,000 | |
| Closed | Cassidy Nancy K | $274,000 | |
| Closed | Mccutcheon Ruth E | $60,000 |
Source: Public Records
Tax History Compared to Growth
Tax History
| Year | Tax Paid | Tax Assessment Tax Assessment Total Assessment is a certain percentage of the fair market value that is determined by local assessors to be the total taxable value of land and additions on the property. | Land | Improvement |
|---|---|---|---|---|
| 2025 | $9,395 | $644,899 | $219,473 | $425,426 |
| 2024 | $9,395 | $632,255 | $215,170 | $417,085 |
| 2023 | $9,201 | $619,858 | $210,951 | $408,907 |
| 2022 | $9,159 | $607,705 | $206,815 | $400,890 |
| 2021 | $8,985 | $595,790 | $202,760 | $393,030 |
| 2020 | $8,585 | $589,681 | $200,681 | $389,000 |
| 2019 | $8,360 | $578,120 | $196,747 | $381,373 |
| 2018 | $8,294 | $566,786 | $192,890 | $373,896 |
| 2017 | $8,222 | $555,673 | $189,108 | $366,565 |
| 2016 | $7,835 | $544,778 | $185,400 | $359,378 |
| 2015 | $7,728 | $536,596 | $182,616 | $353,980 |
| 2014 | $7,078 | $526,086 | $179,039 | $347,047 |
Source: Public Records
Map
Nearby Homes
- 7111 Via Portada
- 7391 Via Cantares
- 7302 Via Granja
- 7369 Via Montecitos
- 5155 Cribari Knolls
- 5009 Cribari Vale
- 5142 Cribari Place
- 5189 Cribari Hills
- 5469 Cribari Green
- 7597 Tayside Ct
- 5235 Cribari Hills
- 5437 Cribari Green
- 5264 Cribari Heights
- 7530 Morevern Cir
- 5424 Cribari Ct
- 5286 Cribari Heights Unit A286
- 5271 Cribari Corner
- 5336 Cribari Glen
- 5302 Cribari Heights
- 7638 Falkirk Dr Unit 7638
- 7141 Via Solana
- 7137 Via Solana
- 7143 Via Solana
- 7135 Via Solana
- 7145 Via Solana
- 7133 Via Solana
- 7138 Via Solana
- 7140 Via Solana
- 7147 Via Solana
- 7136 Via Solana
- 7131 Via Solana
- 7114 Via Portada
- 7119 Via Portada
- 7112 Via Portada
- 7048 Via Belmonte
- 7047 Via Belmonte
- 7110 Via Portada
- 7117 Via Portada
- 7046 Via Valverde
- 7398 Via Cantares
