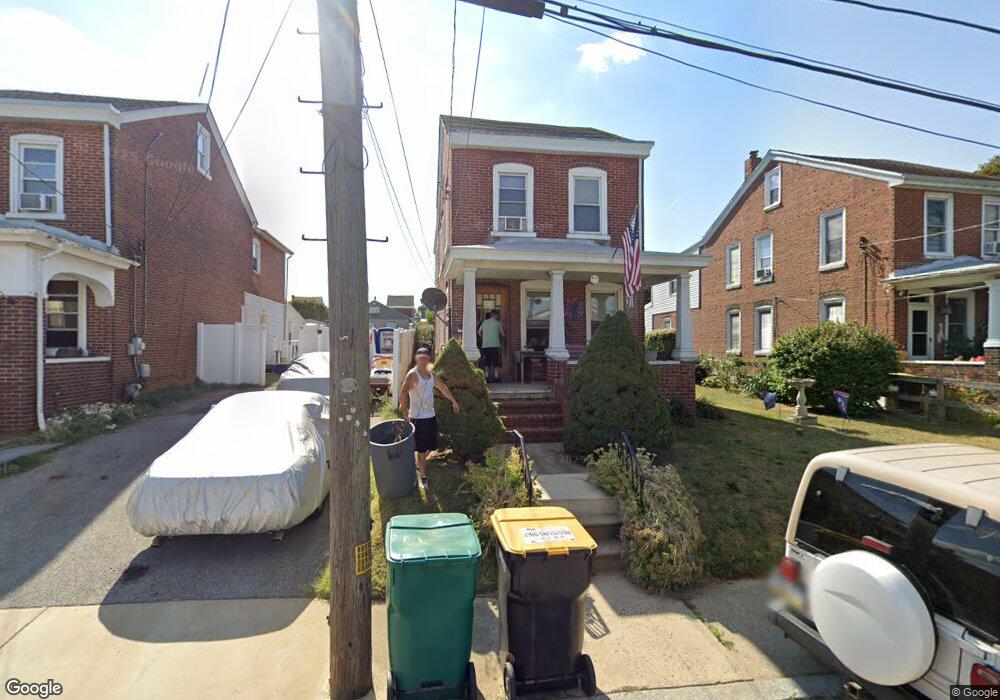
714 Tose St Bridgeport, PA 19405
Estimated Value: $337,000 - $398,000
3
Beds
1
Bath
1,600
Sq Ft
$229/Sq Ft
Est. Value
About This Home
This home is located at 714 Tose St, Bridgeport, PA 19405 and is currently estimated at $366,345, approximately $228 per square foot. 714 Tose St is a home located in Montgomery County with nearby schools including Bridgeport Elementary School, Upper Merion Middle School, and Upper Merion High School.
Ownership History
Date
Name
Owned For
Owner Type
Purchase Details
Closed on
May 28, 2008
Sold by
Grp Loan Llc
Bought by
Cooper Edward and Daneke Ellen S
Current Estimated Value
Home Financials for this Owner
Home Financials are based on the most recent Mortgage that was taken out on this home.
Original Mortgage
$124,000
Outstanding Balance
$79,773
Interest Rate
6.1%
Estimated Equity
$286,572
Purchase Details
Closed on
Feb 14, 2008
Sold by
Roop David A
Bought by
Grp Loan Llc
Purchase Details
Closed on
Jun 20, 2005
Sold by
Roop David A and Roop Lisa M
Bought by
Roop David A
Home Financials for this Owner
Home Financials are based on the most recent Mortgage that was taken out on this home.
Original Mortgage
$140,000
Interest Rate
6.35%
Mortgage Type
Adjustable Rate Mortgage/ARM
Purchase Details
Closed on
Oct 31, 1997
Sold by
Czapla Angela
Bought by
Roop David A and Roop Lisa M
Create a Home Valuation Report for This Property
The Home Valuation Report is an in-depth analysis detailing your home's value as well as a comparison with similar homes in the area
Home Values in the Area
Average Home Value in this Area
Purchase History
| Date | Buyer | Sale Price | Title Company |
|---|---|---|---|
| Cooper Edward | $155,000 | None Available | |
| Grp Loan Llc | $1,483 | None Available | |
| Roop David A | -- | -- | |
| Roop David A | $95,000 | -- |
Source: Public Records
Mortgage History
| Date | Status | Borrower | Loan Amount |
|---|---|---|---|
| Open | Cooper Edward | $124,000 | |
| Previous Owner | Roop David A | $140,000 |
Source: Public Records
Tax History Compared to Growth
Tax History
| Year | Tax Paid | Tax Assessment Tax Assessment Total Assessment is a certain percentage of the fair market value that is determined by local assessors to be the total taxable value of land and additions on the property. | Land | Improvement |
|---|---|---|---|---|
| 2025 | $3,497 | $113,480 | $53,100 | $60,380 |
| 2024 | $3,497 | $113,480 | $53,100 | $60,380 |
| 2023 | $3,373 | $113,480 | $53,100 | $60,380 |
| 2022 | $3,229 | $113,480 | $53,100 | $60,380 |
| 2021 | $3,129 | $113,480 | $53,100 | $60,380 |
| 2020 | $2,990 | $113,480 | $53,100 | $60,380 |
| 2019 | $2,939 | $113,480 | $53,100 | $60,380 |
| 2018 | $2,939 | $113,480 | $53,100 | $60,380 |
| 2017 | $2,833 | $113,480 | $53,100 | $60,380 |
| 2016 | $2,790 | $113,480 | $53,100 | $60,380 |
| 2015 | $2,686 | $113,480 | $53,100 | $60,380 |
| 2014 | $2,686 | $113,480 | $53,100 | $60,380 |
Source: Public Records
Map
Nearby Homes