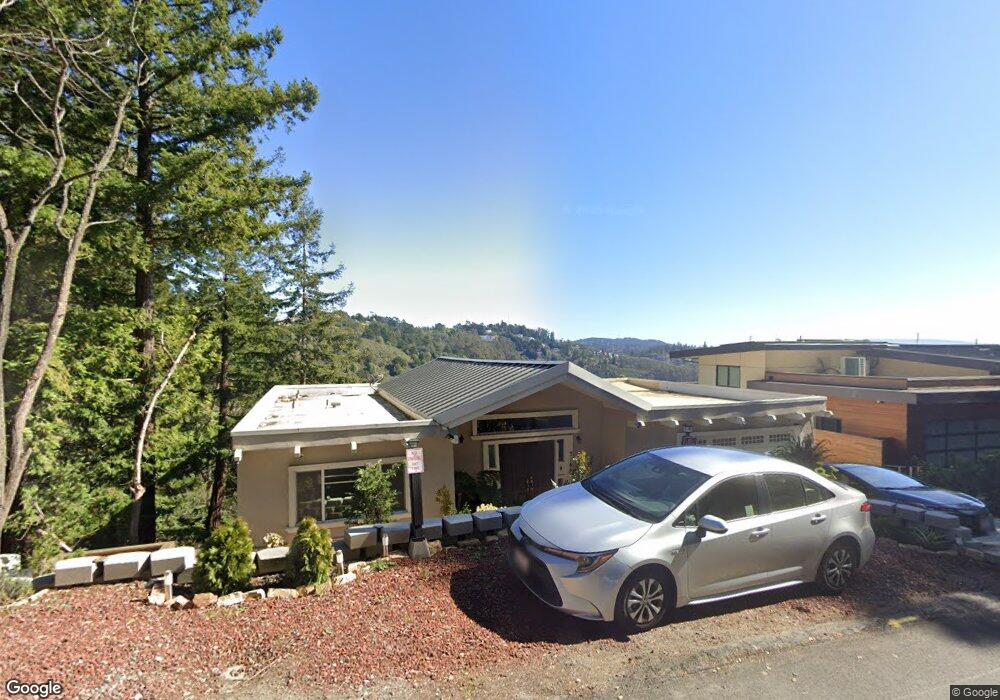
7144 Marlborough Terrace Berkeley, CA 94705
Claremont Hills NeighborhoodEstimated Value: $1,826,000 - $2,159,000
5
Beds
4
Baths
4,017
Sq Ft
$493/Sq Ft
Est. Value
About This Home
This home is located at 7144 Marlborough Terrace, Berkeley, CA 94705 and is currently estimated at $1,981,000, approximately $493 per square foot. 7144 Marlborough Terrace is a home located in Alameda County with nearby schools including Chabot Elementary School, Thornhill Elementary School, and Claremont Middle School.
Ownership History
Date
Name
Owned For
Owner Type
Purchase Details
Closed on
Oct 17, 2018
Sold by
Kwong Choi Yee
Bought by
Huang Ying Yu
Current Estimated Value
Purchase Details
Closed on
Oct 15, 2018
Sold by
Sf Financial Group Llc
Bought by
Kwong Wai Ho and Huang Ying Yu
Purchase Details
Closed on
Oct 11, 2018
Sold by
Huynh Madison Lin
Bought by
Kwong Wai Ho
Purchase Details
Closed on
Jul 9, 2012
Sold by
Jorgensen Eric Vincent and Martinsen Catherine Ann Jorgensen
Bought by
Sf Financial Group Llc
Home Financials for this Owner
Home Financials are based on the most recent Mortgage that was taken out on this home.
Original Mortgage
$386,750
Interest Rate
3.7%
Mortgage Type
New Conventional
Purchase Details
Closed on
Apr 2, 2009
Sold by
Jorgensen Concetta
Bought by
Jorgensen Concetta
Create a Home Valuation Report for This Property
The Home Valuation Report is an in-depth analysis detailing your home's value as well as a comparison with similar homes in the area
Home Values in the Area
Average Home Value in this Area
Purchase History
| Date | Buyer | Sale Price | Title Company |
|---|---|---|---|
| Huang Ying Yu | -- | Fidelity National Title Comp | |
| Kwong Wai Ho | $1,375,000 | Fidelity National Title Comp | |
| Kwong Wai Ho | -- | Fidelity National Title Comp | |
| Sf Financial Group Llc | $595,000 | Chicago Title Company | |
| Jorgensen Concetta | -- | None Available |
Source: Public Records
Mortgage History
| Date | Status | Borrower | Loan Amount |
|---|---|---|---|
| Previous Owner | Sf Financial Group Llc | $386,750 |
Source: Public Records
Tax History
| Year | Tax Paid | Tax Assessment Tax Assessment Total Assessment is a certain percentage of the fair market value that is determined by local assessors to be the total taxable value of land and additions on the property. | Land | Improvement |
|---|---|---|---|---|
| 2025 | $20,808 | $1,526,811 | $460,143 | $1,073,668 |
| 2024 | $20,808 | $1,496,740 | $451,122 | $1,052,618 |
| 2023 | $22,021 | $1,474,260 | $442,278 | $1,031,982 |
| 2022 | $21,559 | $1,438,358 | $433,607 | $1,011,751 |
| 2021 | $20,872 | $1,410,020 | $425,106 | $991,914 |
| 2020 | $20,646 | $1,402,500 | $420,750 | $981,750 |
| 2019 | $20,034 | $1,375,000 | $412,500 | $962,500 |
| 2018 | $10,084 | $643,938 | $193,181 | $450,757 |
| 2017 | $9,707 | $631,311 | $189,393 | $441,918 |
| 2016 | $9,407 | $618,936 | $185,681 | $433,255 |
| 2015 | $9,358 | $609,642 | $182,892 | $426,750 |
| 2014 | $9,452 | $597,700 | $179,310 | $418,390 |
Source: Public Records
Map
Nearby Homes
- 7101 Marlborough Terrace
- 7003 Buckingham Blvd
- 0 Buckingham Blvd Unit 41115384
- 7041 Devon Way
- 6971 Bristol Dr
- 280 Caldecott Ln Unit 221
- 6869 Bristol Dr
- 6716 Charing Cross Rd
- 6839 Sherwick Dr
- 0 Gypsy Ln
- 0 Dartmouth Dr
- 1383 Alvarado Rd
- 1102 Grand View Dr
- 180 Caldecott Ln Unit 314
- 5 Woodside Way
- 1375 Alvarado Rd
- 1881 Grand View Dr
- 320 Caldecott Ln Unit 116
- 0 Tunnel Rd Unit 41087686
- 0 Tunnel Rd Unit 41085045
- 7134 Marlborough Terrace
- 7126 Marlborough Terrace
- 7145 Marlborough Terrace
- 7155 Marlborough Terrace
- 7118 Marlborough Terrace
- 0 Marlborough Terrace
- 7135 Marlborough Terrace
- 7156 Marlborough Terrace
- 7112 Marlborough Terrace
- 7125 Marlborough Terrace
- 7125 Westmoorland Dr
- 7150 Norfolk Rd
- 7160 Marlborough Terrace
- 7115 Marlborough Terrace
- 7156 Norfolk Rd
- 7106 Marlborough Terrace
- 7174 Norfolk Rd
- 7172 Norfolk Rd
- 7117 Westmoorland Dr
- 7105 Marlborough Terrace
Your Personal Tour Guide
Ask me questions while you tour the home.