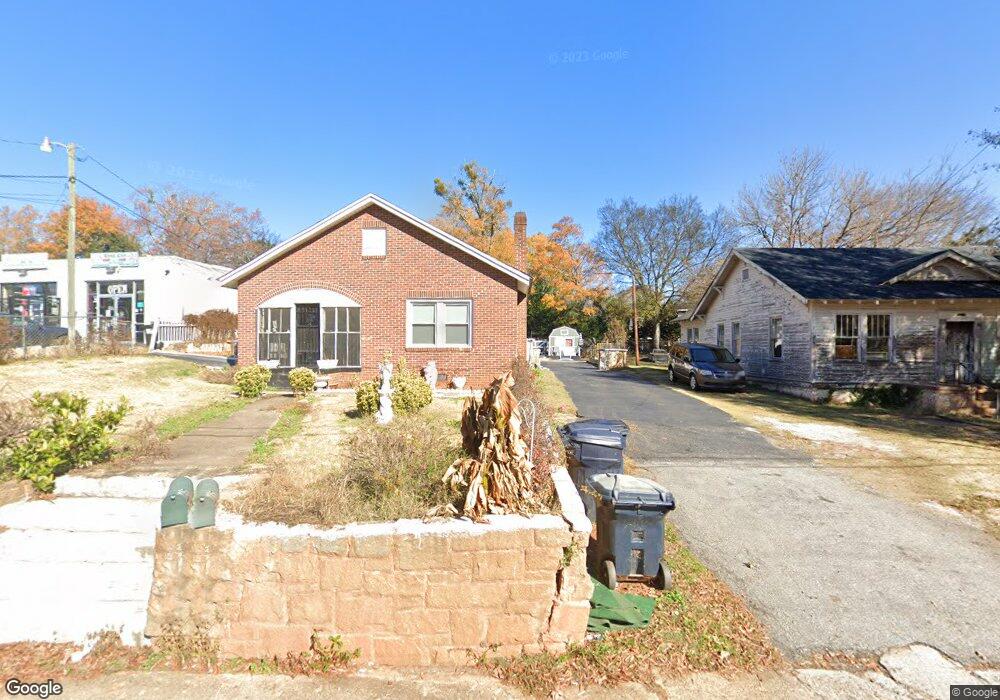
715 E Whitner St Anderson, SC 29624
Estimated Value: $83,454 - $176,000
Studio
3
Baths
1,721
Sq Ft
$80/Sq Ft
Est. Value
About This Home
This home is located at 715 E Whitner St, Anderson, SC 29624 and is currently estimated at $137,614, approximately $79 per square foot. 715 E Whitner St is a home located in Anderson County with nearby schools including Calhoun Academy of the Arts, Glenview Middle School, and T.L. Hanna High School.
Ownership History
Date
Name
Owned For
Owner Type
Purchase Details
Closed on
Feb 21, 2023
Sold by
Boston Jimmy Judge
Bought by
Belton Chifornia S
Current Estimated Value
Purchase Details
Closed on
Aug 6, 2013
Sold by
Telford Robert L
Bought by
Boston Jimmy
Purchase Details
Closed on
Sep 1, 2009
Sold by
Clawson Sandra A
Bought by
Telford Robert L
Purchase Details
Closed on
Jun 30, 2008
Sold by
Bank Of New York
Bought by
Clawson Sandra A
Purchase Details
Closed on
May 23, 2008
Sold by
Boston Mary F
Bought by
Bank Of New York and Certificateholders Cwabs Inc Asset Backe
Purchase Details
Closed on
Oct 26, 2005
Sold by
Boston Jimmy J
Bought by
Boston Mary F
Home Financials for this Owner
Home Financials are based on the most recent Mortgage that was taken out on this home.
Original Mortgage
$73,100
Interest Rate
7.99%
Mortgage Type
Adjustable Rate Mortgage/ARM
Purchase Details
Closed on
Sep 13, 2004
Sold by
Boston Jimmy J
Bought by
Boston Jimmy J and Boston Mary F
Create a Home Valuation Report for This Property
The Home Valuation Report is an in-depth analysis detailing your home's value as well as a comparison with similar homes in the area
Home Values in the Area
Average Home Value in this Area
Purchase History
| Date | Buyer | Sale Price | Title Company |
|---|---|---|---|
| Belton Chifornia S | -- | -- | |
| Boston Jimmy | $20,000 | -- | |
| Telford Robert L | $11,108 | -- | |
| Clawson Sandra A | $9,000 | -- | |
| Bank Of New York | $5,000 | -- | |
| Boston Mary F | -- | -- | |
| Boston Jimmy J | -- | -- | |
| Boston Jimmy J | $25,000 | -- |
Source: Public Records
Mortgage History
| Date | Status | Borrower | Loan Amount |
|---|---|---|---|
| Previous Owner | Boston Mary F | $73,100 |
Source: Public Records
Tax History
| Year | Tax Paid | Tax Assessment Tax Assessment Total Assessment is a certain percentage of the fair market value that is determined by local assessors to be the total taxable value of land and additions on the property. | Land | Improvement |
|---|---|---|---|---|
| 2024 | $876 | $1,920 | $290 | $1,630 |
| 2023 | $874 | $1,280 | $190 | $1,090 |
| 2022 | $40 | $1,280 | $190 | $1,090 |
| 2021 | $40 | $1,060 | $120 | $940 |
| 2020 | $40 | $1,060 | $120 | $940 |
| 2019 | $40 | $1,060 | $120 | $940 |
| 2018 | $40 | $1,060 | $120 | $940 |
| 2017 | -- | $1,060 | $120 | $940 |
| 2016 | $40 | $1,230 | $160 | $1,070 |
| 2015 | $40 | $1,230 | $160 | $1,070 |
| 2014 | $40 | $1,870 | $160 | $1,710 |
Source: Public Records
Map
Nearby Homes
- 620 E Orr St
- 103 Frances St
- 404 Short St
- 800 Beachwood Ave
- 419 Gray St
- 929 E Whitner St
- 912 Pickens St
- 427 E Orr St
- 1000 Sullivan St
- 510 E Calhoun St
- 109 Farmer St
- 109 Bailey St
- 602 Caughlin Ave
- 908 Kennedy St
- 501 North St
- 1303 E River St
- 1413 E Market St
- 219 E Franklin St
- 502 E Hampton St
- 609 Bonham Ct
- 717 E Whitner St
- 719 E Whitner St
- 108 Dickens Ave
- 103 Ken Hill Ln
- 117 Ken Hill Ln
- 101 Ken Hill Ln
- 204 Dickens Ave
- 722 E Whitner St
- 710 E Whitner St
- 714 E Whitner St
- 706 E Whitner St
- 201 Dickens Ave
- 720 E Whitner St
- 800 E Whitner St
- 105 Dickens Ave
- 208 Dickens Ave
- 802 E Whitner St
- 205 Dickens Ave
- 105 Arlington Ave
- 804 E Whitner St
Your Personal Tour Guide
Ask me questions while you tour the home.