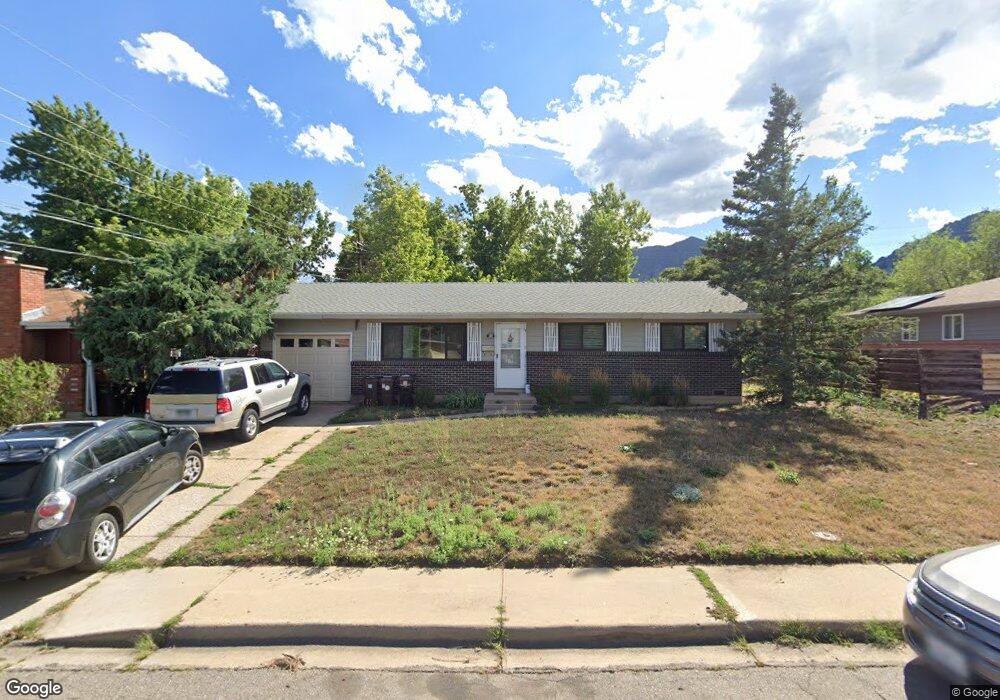
715 Gillaspie Dr Boulder, CO 80305
Table Mesa NeighborhoodEstimated Value: $790,000 - $1,002,000
3
Beds
1
Bath
1,026
Sq Ft
$895/Sq Ft
Est. Value
About This Home
This home is located at 715 Gillaspie Dr, Boulder, CO 80305 and is currently estimated at $918,351, approximately $895 per square foot. 715 Gillaspie Dr is a home located in Boulder County with nearby schools including Bear Creek Elementary School, Mesa Elementary School, and Southern Hills Middle School.
Ownership History
Date
Name
Owned For
Owner Type
Purchase Details
Closed on
Aug 27, 2024
Sold by
Wood Mark A
Bought by
Wood Mark A and Wood Jacquelyn Monica
Current Estimated Value
Purchase Details
Closed on
Sep 9, 2013
Sold by
Wood Rachelle S
Bought by
Wood Mark A
Home Financials for this Owner
Home Financials are based on the most recent Mortgage that was taken out on this home.
Original Mortgage
$100,000
Interest Rate
4.62%
Mortgage Type
New Conventional
Purchase Details
Closed on
Aug 27, 1992
Bought by
Wood Mark A
Purchase Details
Closed on
Apr 15, 1988
Bought by
Wood Mark A
Purchase Details
Closed on
Nov 12, 1987
Bought by
Wood Mark A
Purchase Details
Closed on
Aug 26, 1985
Bought by
Wood Mark A
Create a Home Valuation Report for This Property
The Home Valuation Report is an in-depth analysis detailing your home's value as well as a comparison with similar homes in the area
Home Values in the Area
Average Home Value in this Area
Purchase History
| Date | Buyer | Sale Price | Title Company |
|---|---|---|---|
| Wood Mark A | -- | None Listed On Document | |
| Wood Mark A | -- | Stewart Title | |
| Wood Mark A | -- | -- | |
| Wood Mark A | -- | -- | |
| Wood Mark A | -- | -- | |
| Wood Mark A | $77,500 | -- |
Source: Public Records
Mortgage History
| Date | Status | Borrower | Loan Amount |
|---|---|---|---|
| Previous Owner | Wood Mark A | $100,000 |
Source: Public Records
Tax History Compared to Growth
Tax History
| Year | Tax Paid | Tax Assessment Tax Assessment Total Assessment is a certain percentage of the fair market value that is determined by local assessors to be the total taxable value of land and additions on the property. | Land | Improvement |
|---|---|---|---|---|
| 2025 | $4,976 | $53,738 | $48,364 | $5,374 |
| 2024 | $4,976 | $53,738 | $48,364 | $5,374 |
| 2023 | $4,890 | $56,622 | $54,276 | $6,031 |
| 2022 | $4,542 | $48,914 | $44,023 | $4,891 |
| 2021 | $4,331 | $50,322 | $45,290 | $5,032 |
| 2020 | $3,796 | $43,615 | $34,892 | $8,723 |
| 2019 | $3,738 | $43,615 | $34,892 | $8,723 |
| 2018 | $3,637 | $41,947 | $29,880 | $12,067 |
| 2017 | $3,523 | $46,375 | $33,034 | $13,341 |
| 2016 | $3,144 | $36,322 | $24,119 | $12,203 |
| 2015 | $2,977 | $28,449 | $14,248 | $14,201 |
| 2014 | $2,392 | $28,449 | $14,248 | $14,201 |
Source: Public Records
Map
Nearby Homes
- 2955 Stanford Ave
- 2860 Table Mesa Dr
- 1120 Hartford Dr
- 2585 Kohler Dr
- 2880 La Grange Cir
- 1265 Hartford Dr
- 450 S 40th St
- 960 Toedtli Dr
- 450 S 41st St
- 2235 Vassar Dr
- 140 S Lashley Ln
- 1395 Drexel St
- 3450 Emerson Ave
- 4350 Butler Cir
- 725 S 45th St
- 1535 Findlay Way
- 2100 Kohler Dr
- 3682 Chase Ct
- 3410 Heidelberg Dr
- 3310 Heidelberg Dr