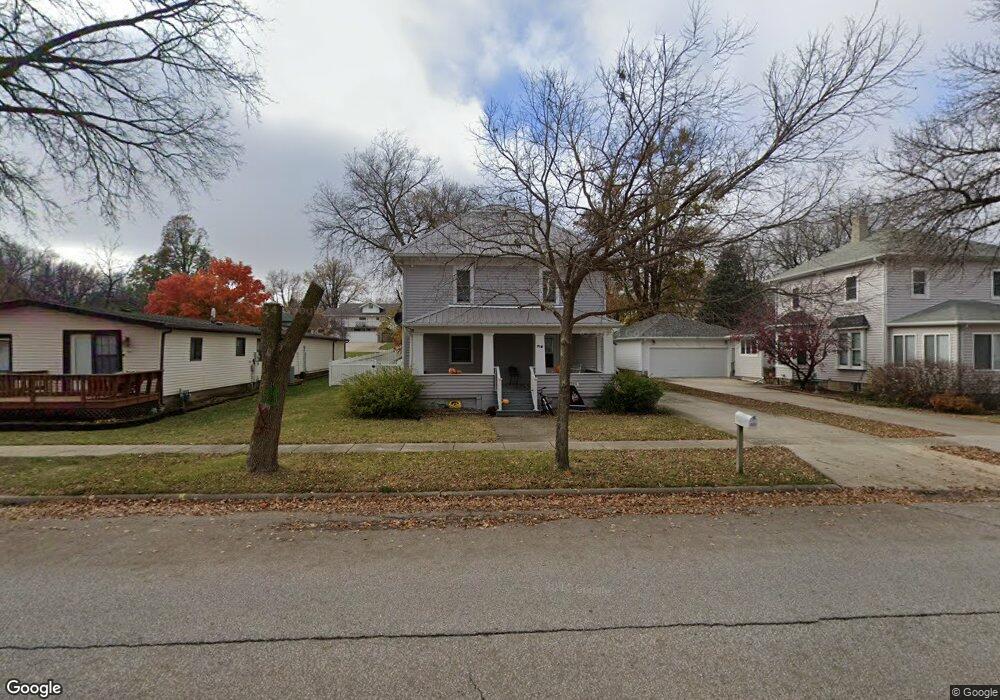
715 High St Lake View, IA 51450
Estimated Value: $133,000 - $186,000
--
Bed
--
Bath
1,510
Sq Ft
$104/Sq Ft
Est. Value
About This Home
This home is located at 715 High St, Lake View, IA 51450 and is currently estimated at $157,315, approximately $104 per square foot. 715 High St is a home located in Sac County with nearby schools including East Sac County High School.
Ownership History
Date
Name
Owned For
Owner Type
Purchase Details
Closed on
Jul 20, 2019
Sold by
Rees Susan M and Rees James F
Bought by
Mohr Blake R and Mohr Sarah M
Current Estimated Value
Home Financials for this Owner
Home Financials are based on the most recent Mortgage that was taken out on this home.
Original Mortgage
$66,451
Outstanding Balance
$58,109
Interest Rate
3.73%
Mortgage Type
Balloon
Estimated Equity
$99,206
Purchase Details
Closed on
Apr 13, 2006
Sold by
Partridge Rosemary N and Partridge D
Bought by
Reese Susan M
Purchase Details
Closed on
Apr 20, 2005
Sold by
Partridge Rosemary N and Partridge D
Bought by
Reese Susan M
Create a Home Valuation Report for This Property
The Home Valuation Report is an in-depth analysis detailing your home's value as well as a comparison with similar homes in the area
Home Values in the Area
Average Home Value in this Area
Purchase History
| Date | Buyer | Sale Price | Title Company |
|---|---|---|---|
| Mohr Blake R | -- | -- | |
| Reese Susan M | -- | None Available | |
| Reese Susan M | -- | None Available |
Source: Public Records
Mortgage History
| Date | Status | Borrower | Loan Amount |
|---|---|---|---|
| Open | Mohr Blake R | $66,451 |
Source: Public Records
Tax History Compared to Growth
Tax History
| Year | Tax Paid | Tax Assessment Tax Assessment Total Assessment is a certain percentage of the fair market value that is determined by local assessors to be the total taxable value of land and additions on the property. | Land | Improvement |
|---|---|---|---|---|
| 2025 | $1,578 | $149,740 | $3,810 | $145,930 |
| 2024 | $1,578 | $126,420 | $3,470 | $122,950 |
| 2023 | $1,224 | $126,420 | $3,470 | $122,950 |
| 2022 | $1,186 | $91,670 | $3,470 | $88,200 |
| 2021 | $1,186 | $91,670 | $3,470 | $88,200 |
| 2020 | $890 | $71,930 | $3,470 | $68,460 |
| 2019 | $832 | $60,690 | $3,470 | $57,220 |
| 2018 | $832 | $55,590 | $0 | $0 |
| 2017 | $832 | $50,720 | $0 | $0 |
| 2016 | $768 | $50,720 | $0 | $0 |
| 2015 | $768 | $48,860 | $0 | $0 |
| 2014 | $744 | $48,860 | $0 | $0 |
Source: Public Records
Map
Nearby Homes