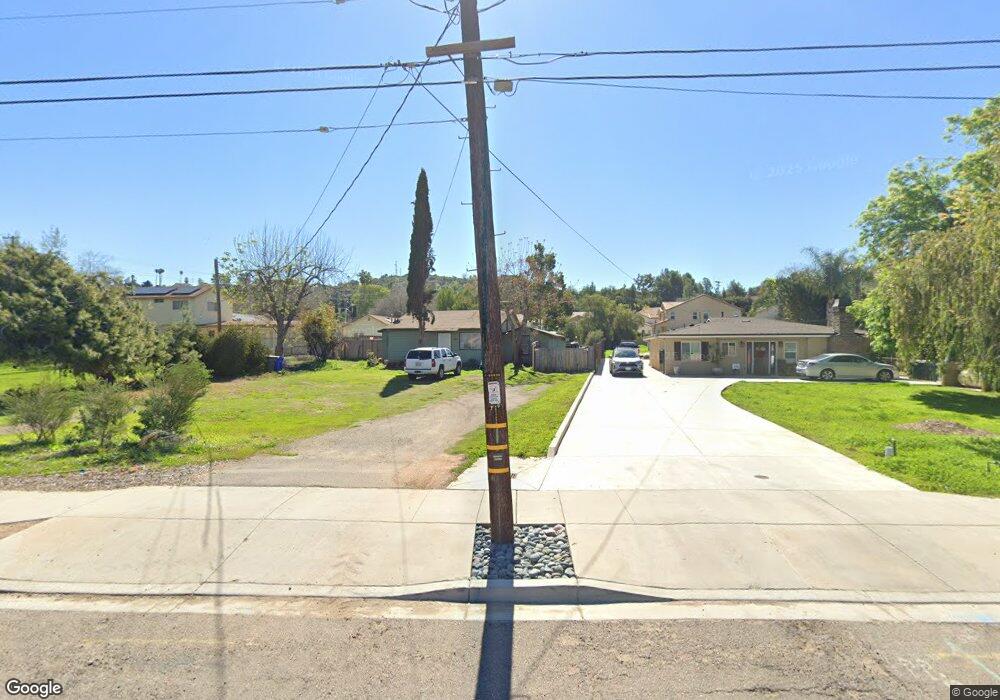
715 Lehner Ave Escondido, CA 92026
North Broadway NeighborhoodEstimated Value: $471,000 - $684,860
2
Beds
1
Bath
672
Sq Ft
$860/Sq Ft
Est. Value
About This Home
This home is located at 715 Lehner Ave, Escondido, CA 92026 and is currently estimated at $577,965, approximately $860 per square foot. 715 Lehner Ave is a home located in San Diego County with nearby schools including North Broadway Elementary School, Rincon Middle School, and Escondido High School.
Ownership History
Date
Name
Owned For
Owner Type
Purchase Details
Closed on
Aug 23, 2021
Sold by
Mittman Michael Roy
Bought by
Mittman Michael Roy and The Michael Roy Mittman Living
Current Estimated Value
Purchase Details
Closed on
Jul 12, 2000
Sold by
Hammontree Cynthia J
Bought by
Mittman Michael Roy
Home Financials for this Owner
Home Financials are based on the most recent Mortgage that was taken out on this home.
Original Mortgage
$85,000
Outstanding Balance
$30,222
Interest Rate
8.14%
Estimated Equity
$547,743
Purchase Details
Closed on
Aug 16, 1995
Sold by
Cavanagh Velda L
Bought by
Mittman Michael Roy
Home Financials for this Owner
Home Financials are based on the most recent Mortgage that was taken out on this home.
Original Mortgage
$65,400
Interest Rate
7.48%
Mortgage Type
Seller Take Back
Create a Home Valuation Report for This Property
The Home Valuation Report is an in-depth analysis detailing your home's value as well as a comparison with similar homes in the area
Home Values in the Area
Average Home Value in this Area
Purchase History
| Date | Buyer | Sale Price | Title Company |
|---|---|---|---|
| Mittman Michael Roy | -- | None Available | |
| Mittman Michael Roy | -- | South Coast Title Company | |
| Mittman Michael Roy | $70,000 | Fidelity National Title |
Source: Public Records
Mortgage History
| Date | Status | Borrower | Loan Amount |
|---|---|---|---|
| Open | Mittman Michael Roy | $85,000 | |
| Previous Owner | Mittman Michael Roy | $65,400 |
Source: Public Records
Tax History Compared to Growth
Tax History
| Year | Tax Paid | Tax Assessment Tax Assessment Total Assessment is a certain percentage of the fair market value that is determined by local assessors to be the total taxable value of land and additions on the property. | Land | Improvement |
|---|---|---|---|---|
| 2025 | $1,308 | $116,252 | $63,593 | $52,659 |
| 2024 | $1,308 | $484,500 | $423,300 | $61,200 |
| 2023 | $1,276 | $111,740 | $61,125 | $50,615 |
| 2022 | $1,260 | $109,550 | $59,927 | $49,623 |
| 2021 | $1,239 | $107,402 | $58,752 | $48,650 |
| 2020 | $1,229 | $106,302 | $58,150 | $48,152 |
| 2019 | $1,199 | $104,218 | $57,010 | $47,208 |
| 2018 | $1,165 | $102,176 | $55,893 | $46,283 |
| 2017 | $741 | $100,174 | $54,798 | $45,376 |
| 2016 | $1,120 | $98,211 | $53,724 | $44,487 |
| 2015 | $1,109 | $96,737 | $52,918 | $43,819 |
| 2014 | $1,060 | $94,843 | $51,882 | $42,961 |
Source: Public Records
Map
Nearby Homes
- Cardiff Plan at Capistrano
- Terramar Plan at Capistrano
- Grandview Plan at Capistrano
- 2046 Woolem Place
- 2035 Woolem Place
- 2066 Woolem Place
- 2086 Woolem Place
- 2096 Woolem Place
- 2085 Woolem Place
- 2031 Wagon Wheel Ct
- 2001 Simpatico Place
- 2153 Pleasantwood Ln
- 2208 Terracewood Ln
- 2257 Brookwood Ct
- 2250 N Broadway Unit 4
- 2250 N Broadway Unit 69
- 1228 Sheridan Ave
- 1907 Centennial Way
- 0 Hubbard Place Unit PTP2405367
- 2337 Douglaston Glen