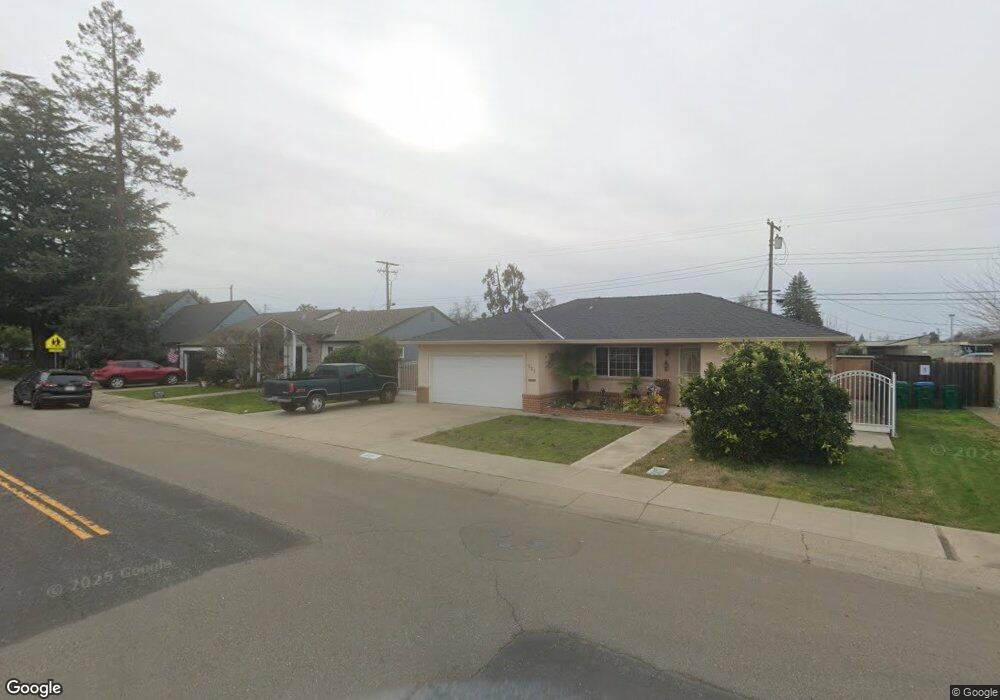
715 N Crescent Ave Lodi, CA 95240
North Lodi NeighborhoodEstimated Value: $322,000 - $459,000
3
Beds
2
Baths
1,236
Sq Ft
$337/Sq Ft
Est. Value
About This Home
This home is located at 715 N Crescent Ave, Lodi, CA 95240 and is currently estimated at $416,735, approximately $337 per square foot. 715 N Crescent Ave is a home located in San Joaquin County with nearby schools including Lakewood Elementary School, Millswood Middle School, and Lodi High School.
Ownership History
Date
Name
Owned For
Owner Type
Purchase Details
Closed on
Dec 29, 2016
Sold by
Gabriel Epifanio
Bought by
Gabriel Epifanio and Gabriel Cleopatra
Current Estimated Value
Home Financials for this Owner
Home Financials are based on the most recent Mortgage that was taken out on this home.
Original Mortgage
$148,000
Interest Rate
4.08%
Mortgage Type
New Conventional
Purchase Details
Closed on
Sep 28, 2016
Sold by
Gabriel Epifanio
Bought by
Gabriel Epifanio and Gabriel Cleopatra
Purchase Details
Closed on
Sep 13, 2005
Sold by
Gabriel Crispino and Gabriel Epifanio
Bought by
Gabriel Epifanio
Home Financials for this Owner
Home Financials are based on the most recent Mortgage that was taken out on this home.
Original Mortgage
$150,000
Interest Rate
5.72%
Mortgage Type
New Conventional
Purchase Details
Closed on
Apr 22, 1999
Sold by
Gabriel Marcela Q
Bought by
Gabriel Crispino and Gabriel Epifanio
Create a Home Valuation Report for This Property
The Home Valuation Report is an in-depth analysis detailing your home's value as well as a comparison with similar homes in the area
Home Values in the Area
Average Home Value in this Area
Purchase History
| Date | Buyer | Sale Price | Title Company |
|---|---|---|---|
| Gabriel Epifanio | -- | Old Republic Title Company | |
| Gabriel Epifanio | -- | None Available | |
| Gabriel Epifanio | -- | Financial Title Co | |
| Gabriel Crispino | -- | -- |
Source: Public Records
Mortgage History
| Date | Status | Borrower | Loan Amount |
|---|---|---|---|
| Closed | Gabriel Epifanio | $148,000 | |
| Closed | Gabriel Epifanio | $150,000 |
Source: Public Records
Tax History Compared to Growth
Tax History
| Year | Tax Paid | Tax Assessment Tax Assessment Total Assessment is a certain percentage of the fair market value that is determined by local assessors to be the total taxable value of land and additions on the property. | Land | Improvement |
|---|---|---|---|---|
| 2025 | $4,644 | $428,344 | $166,933 | $261,411 |
| 2024 | $4,261 | $396,100 | $115,000 | $281,100 |
| 2023 | $4,168 | $384,200 | $115,000 | $269,200 |
| 2022 | $4,366 | $403,640 | $157,305 | $246,335 |
| 2021 | $4,445 | $395,726 | $154,221 | $241,505 |
| 2020 | $4,329 | $391,669 | $152,640 | $239,029 |
| 2019 | $4,242 | $383,991 | $149,648 | $234,343 |
| 2018 | $4,183 | $376,463 | $146,714 | $229,749 |
| 2017 | $4,089 | $369,083 | $143,838 | $225,245 |
| 2016 | $3,833 | $361,849 | $141,019 | $220,830 |
| 2014 | $2,042 | $190,000 | $74,000 | $116,000 |
Source: Public Records
Map
Nearby Homes
- 648 Daisy Ave
- 532 Louie Ave
- 537 Palm Ave
- 400 N Fairmont Ave
- 744 W Turner Rd
- 834 N Ham Ln
- 1114 Lakewood Dr
- 309 Forrest Ave
- 419 Matthew Plaza
- 400 N Pacific Ave
- 407 N Pleasant Ave
- 619 W Elm St
- 411 W Locust St
- 625 N Church St Unit 8
- 303 W Lockeford St
- 431 W Elm St
- 433 N Church St
- 518 N Church St
- 101 de Force Ave
- 101 W Lockeford St
- 711 N Crescent Ave
- 719 N Crescent Ave
- 705 N Crescent Ave
- 723 N Crescent Ave
- 712 Roper Ave
- 708 Roper Ave
- 716 Roper Ave
- 701 N Crescent Ave
- 704 Roper Ave
- 727 N Crescent Ave
- 712 N Crescent Ave
- 716 N Crescent Ave
- 708 N Crescent Ave
- 722 Roper Ave
- 700 Roper Ave
- 661 N Crescent Ave
- 720 N Crescent Ave
- 704 N Crescent Ave
- 731 N Crescent Ave
- 660 Roper Ave