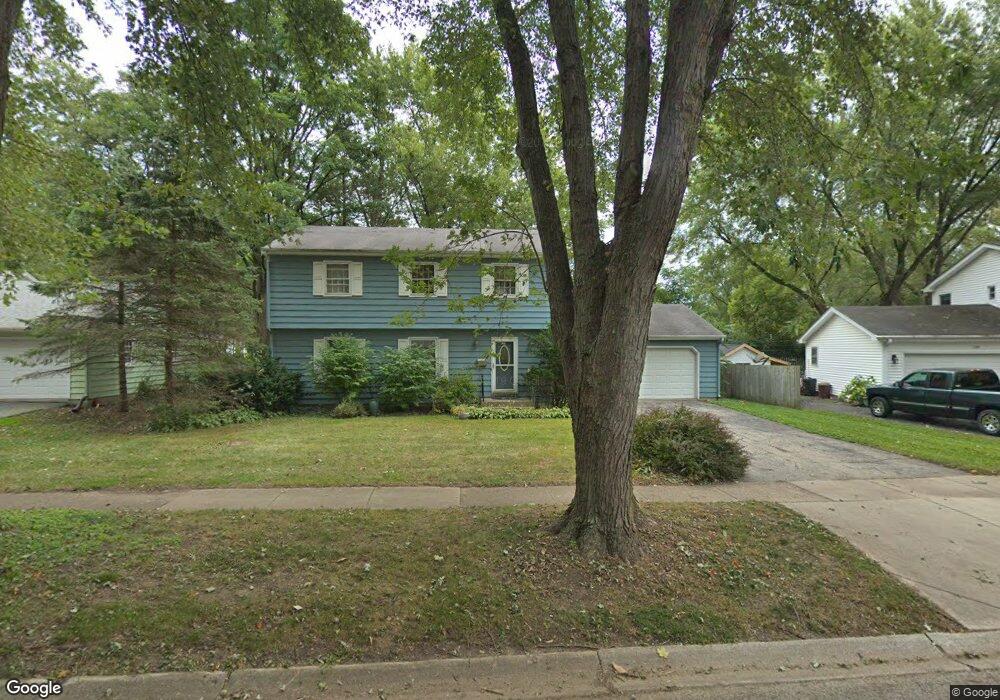
715 Webster St Algonquin, IL 60102
Estimated Value: $369,000 - $403,000
4
Beds
3
Baths
1,944
Sq Ft
$195/Sq Ft
Est. Value
About This Home
This home is located at 715 Webster St, Algonquin, IL 60102 and is currently estimated at $378,575, approximately $194 per square foot. 715 Webster St is a home located in McHenry County with nearby schools including Eastview Elementary School, Algonquin Middle School, and Dundee-Crown High School.
Ownership History
Date
Name
Owned For
Owner Type
Purchase Details
Closed on
Jan 7, 2008
Sold by
Smith Donald W and Anderson Jennifer K
Bought by
Sirva Relocation Credit Llc
Current Estimated Value
Purchase Details
Closed on
Jan 31, 2007
Sold by
Sirva Relocation Credit Llc
Bought by
Ulman Kathleen
Home Financials for this Owner
Home Financials are based on the most recent Mortgage that was taken out on this home.
Original Mortgage
$200,000
Interest Rate
5.74%
Mortgage Type
Unknown
Purchase Details
Closed on
Jul 27, 2005
Sold by
Bradshaw Carol P
Bought by
Smith Donald W and Anderson Jennifer K
Home Financials for this Owner
Home Financials are based on the most recent Mortgage that was taken out on this home.
Original Mortgage
$187,000
Interest Rate
5%
Mortgage Type
Purchase Money Mortgage
Create a Home Valuation Report for This Property
The Home Valuation Report is an in-depth analysis detailing your home's value as well as a comparison with similar homes in the area
Purchase History
| Date | Buyer | Sale Price | Title Company |
|---|---|---|---|
| Sirva Relocation Credit Llc | $250,000 | Stewart Title Company | |
| Ulman Kathleen | $250,000 | Stewart Title Company | |
| Smith Donald W | $247,000 | Multiple |
Source: Public Records
Mortgage History
| Date | Status | Borrower | Loan Amount |
|---|---|---|---|
| Previous Owner | Ulman Kathleen | $200,000 | |
| Previous Owner | Smith Donald W | $187,000 |
Source: Public Records
Tax History
| Year | Tax Paid | Tax Assessment Tax Assessment Total Assessment is a certain percentage of the fair market value that is determined by local assessors to be the total taxable value of land and additions on the property. | Land | Improvement |
|---|---|---|---|---|
| 2024 | $7,503 | $103,914 | $13,535 | $90,379 |
| 2023 | $7,110 | $92,938 | $12,105 | $80,833 |
| 2022 | $6,526 | $82,102 | $16,092 | $66,010 |
| 2021 | $6,255 | $76,488 | $14,992 | $61,496 |
| 2020 | $6,086 | $73,780 | $14,461 | $59,319 |
| 2019 | $5,933 | $70,616 | $13,841 | $56,775 |
| 2018 | $5,646 | $65,234 | $12,786 | $52,448 |
| 2017 | $5,522 | $61,454 | $12,045 | $49,409 |
| 2016 | $5,430 | $57,638 | $11,297 | $46,341 |
| 2013 | -- | $58,957 | $10,539 | $48,418 |
Source: Public Records
Map
Nearby Homes
- 719 Webster St
- 600 E Algonquin Rd
- 1188 E Algonquin Rd
- 953 Old Oak Cir
- 1031 Timberwood Ln
- Lot 4 b Ryan Pkwy
- 0 River Dr N Unit MRD12473279
- 1770 E Algonquin Rd
- 407 La Fox River Dr
- 21 Division St
- 0 Natoma Trail
- 1420 Greenridge Ave
- lot 25 Wabican Trail
- 1730 Tanglewood Dr
- 1782 Cumberland Pkwy
- 1321 Big Sur Pkwy
- 1906 Ozark Pkwy
- 1923 Ozark Pkwy
- 2 Cumberland Pkwy
- 1625 Powder Horn Dr
Your Personal Tour Guide
Ask me questions while you tour the home.