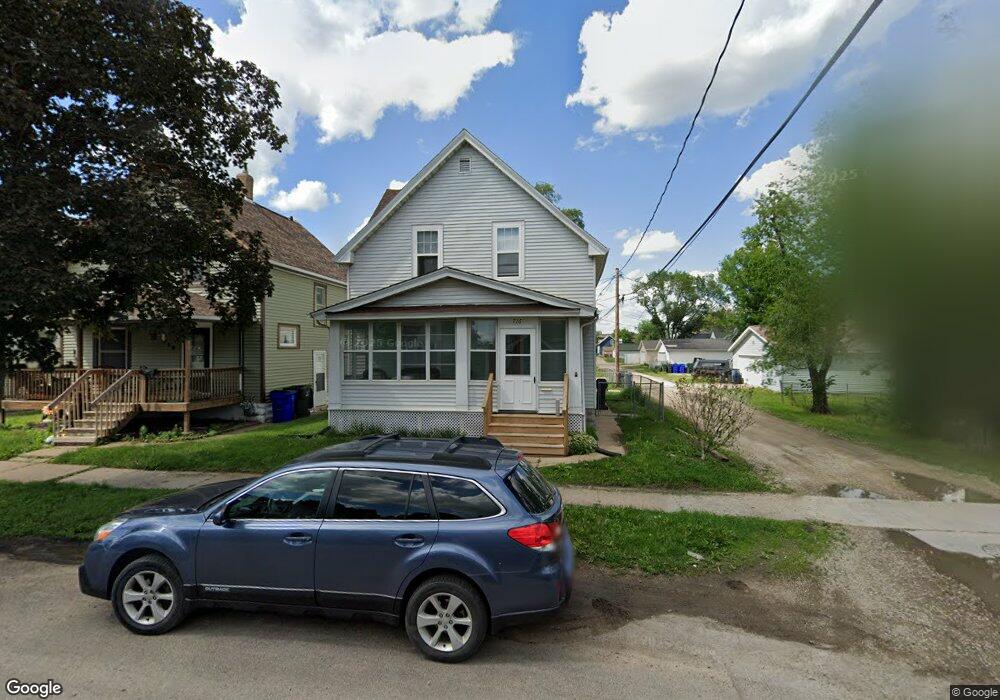
716 9th Ave SW Cedar Rapids, IA 52404
Taylor NeighborhoodEstimated Value: $145,000 - $155,000
4
Beds
2
Baths
1,418
Sq Ft
$107/Sq Ft
Est. Value
About This Home
This home is located at 716 9th Ave SW, Cedar Rapids, IA 52404 and is currently estimated at $151,799, approximately $107 per square foot. 716 9th Ave SW is a home located in Linn County with nearby schools including Junction City Elementary School, Cedar River Academy at Taylor Elementary School, and Bruce Hall Day Treatment Center.
Ownership History
Date
Name
Owned For
Owner Type
Purchase Details
Closed on
May 20, 2021
Sold by
Phillips Michael J
Bought by
Value Add Contracting Llc
Current Estimated Value
Purchase Details
Closed on
Aug 11, 2003
Sold by
Herr Daniel E
Bought by
Phillips Michael J
Home Financials for this Owner
Home Financials are based on the most recent Mortgage that was taken out on this home.
Original Mortgage
$87,720
Interest Rate
5.47%
Mortgage Type
VA
Create a Home Valuation Report for This Property
The Home Valuation Report is an in-depth analysis detailing your home's value as well as a comparison with similar homes in the area
Home Values in the Area
Average Home Value in this Area
Purchase History
| Date | Buyer | Sale Price | Title Company |
|---|---|---|---|
| Value Add Contracting Llc | $53,000 | None Available | |
| Phillips Michael J | $85,500 | -- |
Source: Public Records
Mortgage History
| Date | Status | Borrower | Loan Amount |
|---|---|---|---|
| Previous Owner | Phillips Michael J | $87,720 |
Source: Public Records
Tax History Compared to Growth
Tax History
| Year | Tax Paid | Tax Assessment Tax Assessment Total Assessment is a certain percentage of the fair market value that is determined by local assessors to be the total taxable value of land and additions on the property. | Land | Improvement |
|---|---|---|---|---|
| 2025 | $2,340 | $137,300 | $20,600 | $116,700 |
| 2024 | $2,436 | $127,700 | $18,100 | $109,600 |
| 2023 | $2,436 | $132,200 | $18,100 | $114,100 |
| 2022 | $1,868 | $115,500 | $15,600 | $99,900 |
| 2021 | $1,680 | $90,200 | $15,600 | $74,600 |
| 2020 | $1,680 | $84,700 | $12,300 | $72,400 |
| 2019 | $1,586 | $82,100 | $12,300 | $69,800 |
| 2018 | $1,538 | $82,100 | $12,300 | $69,800 |
| 2017 | $1,709 | $82,400 | $12,300 | $70,100 |
| 2016 | $1,709 | $80,400 | $12,300 | $68,100 |
| 2015 | $1,839 | $86,390 | $12,338 | $74,052 |
| 2014 | $1,654 | $91,202 | $11,550 | $79,652 |
| 2013 | $1,714 | $91,202 | $11,550 | $79,652 |
Source: Public Records
Map
Nearby Homes