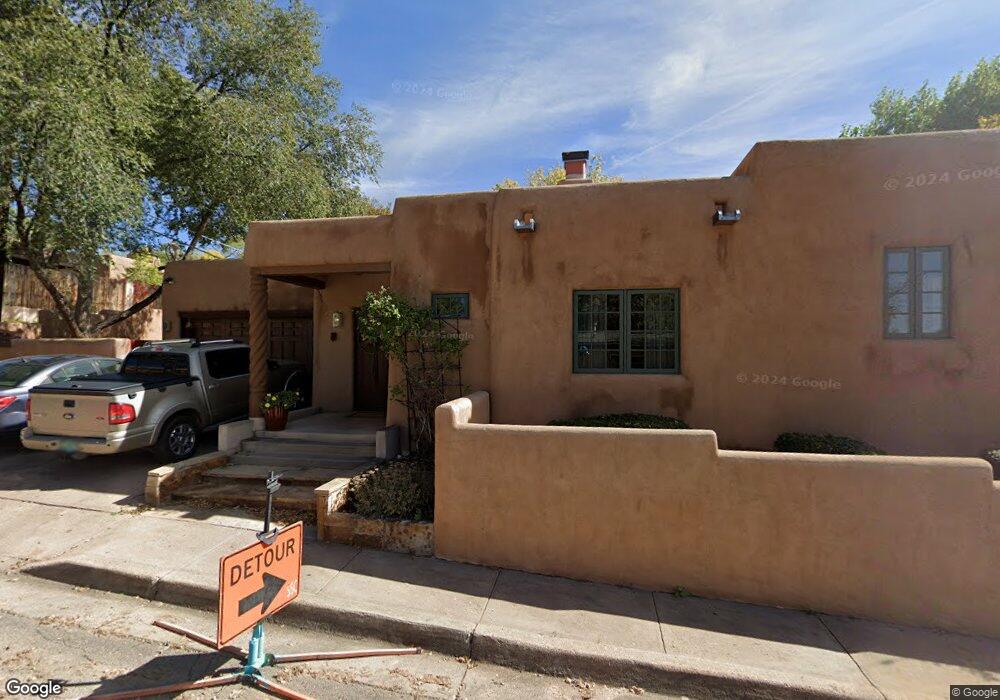
716 E Palace Ave Santa Fe, NM 87501
North Hills NeighborhoodEstimated Value: $1,513,934 - $2,070,000
4
Beds
--
Bath
2,770
Sq Ft
$645/Sq Ft
Est. Value
About This Home
This home is located at 716 E Palace Ave, Santa Fe, NM 87501 and is currently estimated at $1,785,984, approximately $644 per square foot. 716 E Palace Ave is a home located in Santa Fe County with nearby schools including Acequia Madre Elementary School, Santa Fe High School, and Journey Montessori School.
Ownership History
Date
Name
Owned For
Owner Type
Purchase Details
Closed on
Aug 31, 2016
Sold by
Douglas And Bonita Stewar T Living Tru
Bought by
Stewart Bonita B and Stewart Douglas R
Current Estimated Value
Home Financials for this Owner
Home Financials are based on the most recent Mortgage that was taken out on this home.
Original Mortgage
$921,600
Outstanding Balance
$730,609
Interest Rate
3.45%
Mortgage Type
VA
Estimated Equity
$1,055,375
Purchase Details
Closed on
Mar 9, 2010
Sold by
Stewart Douglas R and Stewart Bonita Brody
Bought by
Stewart Douglas R and Stewart Bonita Brody
Purchase Details
Closed on
Mar 19, 2008
Sold by
Stewart Bonita K Brody and Stewart Douglas Robert
Bought by
Stewart Douglas R and Stewart Bonita Brody
Home Financials for this Owner
Home Financials are based on the most recent Mortgage that was taken out on this home.
Original Mortgage
$800,000
Interest Rate
5.72%
Mortgage Type
Construction
Create a Home Valuation Report for This Property
The Home Valuation Report is an in-depth analysis detailing your home's value as well as a comparison with similar homes in the area
Home Values in the Area
Average Home Value in this Area
Purchase History
| Date | Buyer | Sale Price | Title Company |
|---|---|---|---|
| Stewart Bonita B | -- | -- | |
| Douglas And Bonita Stewart Living Tru | -- | -- | |
| Stewart Bonita B | -- | -- | |
| Stewart Douglas R | -- | None Available | |
| Stewart Douglas R | -- | St&E |
Source: Public Records
Mortgage History
| Date | Status | Borrower | Loan Amount |
|---|---|---|---|
| Open | Stewart Bonita B | $921,600 | |
| Closed | Stewart Bonita B | $921,600 | |
| Closed | Stewart Bonita B | -- | |
| Previous Owner | Stewart Douglas R | $800,000 |
Source: Public Records
Tax History
| Year | Tax Paid | Tax Assessment Tax Assessment Total Assessment is a certain percentage of the fair market value that is determined by local assessors to be the total taxable value of land and additions on the property. | Land | Improvement |
|---|---|---|---|---|
| 2025 | $8,552 | $1,126,614 | $130,192 | $996,422 |
| 2024 | $8,335 | $1,093,800 | $126,400 | $967,400 |
| 2023 | $8,335 | $1,061,943 | $122,719 | $939,224 |
| 2022 | $8,151 | $1,031,013 | $119,145 | $911,868 |
| 2021 | $8,025 | $333,661 | $38,558 | $295,103 |
| 2020 | $7,784 | $323,943 | $38,558 | $285,385 |
| 2019 | $7,676 | $314,508 | $83,333 | $231,175 |
| 2018 | $7,574 | $308,119 | $83,333 | $224,786 |
| 2017 | $7,448 | $301,729 | $83,333 | $218,396 |
| 2016 | $7,135 | $297,618 | $83,333 | $214,285 |
| 2015 | $6,969 | $288,950 | $83,333 | $205,617 |
| 2014 | $6,768 | $289,414 | $83,250 | $206,164 |
Source: Public Records
Map
Nearby Homes
- 707 E Palace Ave Unit 8
- 707 E Palace Ave Unit 11
- 815 E Palace Ave Unit 22
- 637 E Alameda St
- 630 E Alameda St Unit A, B, C, E, F, G & I
- 841 E Alameda St Unit C
- 840 E Palace Ave Unit 6
- 220 Rodriguez St
- 227 Rodriguez St
- 868 E Alameda St
- 1 Cerro Gordo Rd Unit B
- 5 Cerro Gordo Rd Unit 1
- 634 Canyon Rd
- 516 Hillside Ave
- 531 Hillside Ave
- 535 Hillside Ave
- 617 1/2 Acequia Madre
- 420 Camino Don Miguel
- 625 Garcia St
- 414 A and B Camino Don Miguel
- 720 E Palace Ave
- 708 E Palace Ave
- 706 E Palace Ave
- 706 E Palace Ave Unit A&B
- 707 E Palace Avenue #10
- 707 E Palace Avenue #10 Unit 10
- 707 E Palace Avenue #7
- 707 E Palace Avenue #7 Unit 7
- 707 E Palace Ave
- 707 E Palace Ave
- 707 E Palace Ave
- 707 E Palace Ave
- 707 E Palace Ave
- 707 E Palace Ave
- 707 E Palace Ave Unit 24
- 707 E Palace Ave
- 707 E Palace Ave
- 707 E Palace Ave Unit 28
- 707 E Palace Ave
- 707 E Palace Ave Unit 25
Your Personal Tour Guide
Ask me questions while you tour the home.