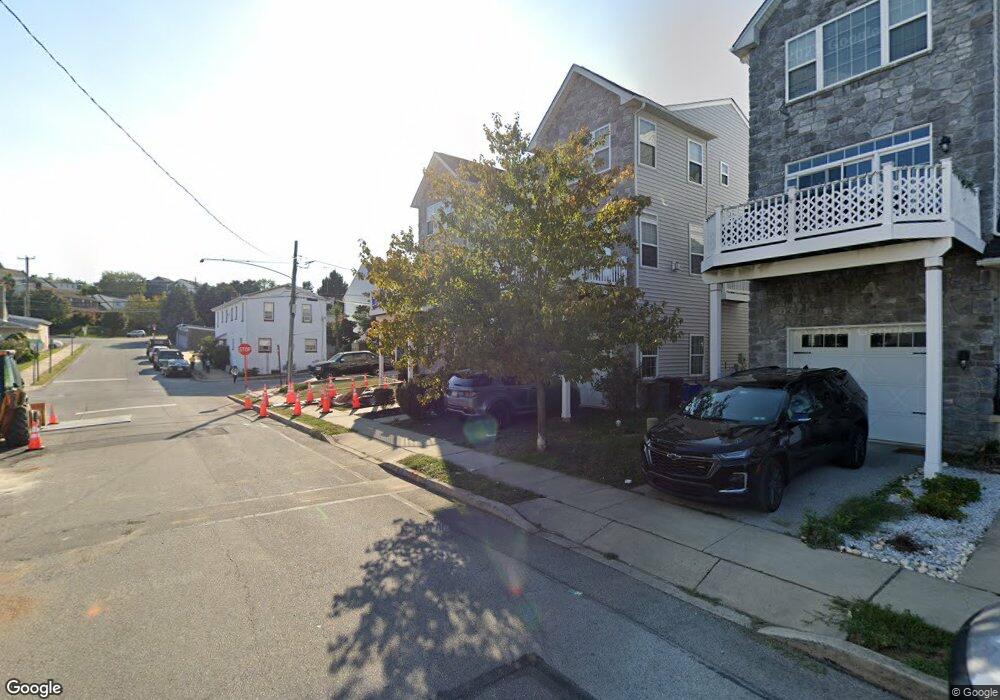
716 Mill St Bridgeport, PA 19405
Estimated Value: $444,000 - $584,231
4
Beds
4
Baths
2,400
Sq Ft
$215/Sq Ft
Est. Value
About This Home
This home is located at 716 Mill St, Bridgeport, PA 19405 and is currently estimated at $515,058, approximately $214 per square foot. 716 Mill St is a home located in Montgomery County with nearby schools including Bridgeport Elementary School, Upper Merion Middle School, and Upper Merion High School.
Ownership History
Date
Name
Owned For
Owner Type
Purchase Details
Closed on
Jul 21, 2023
Sold by
Dugan Joseph P and Dugan Cathy
Bought by
Dugan Colleen
Current Estimated Value
Purchase Details
Closed on
Oct 15, 2008
Sold by
Gale Kevin
Bought by
Dugan Cathy and Dugan Joseph P
Home Financials for this Owner
Home Financials are based on the most recent Mortgage that was taken out on this home.
Original Mortgage
$243,485
Interest Rate
5.83%
Create a Home Valuation Report for This Property
The Home Valuation Report is an in-depth analysis detailing your home's value as well as a comparison with similar homes in the area
Home Values in the Area
Average Home Value in this Area
Purchase History
| Date | Buyer | Sale Price | Title Company |
|---|---|---|---|
| Dugan Colleen | -- | None Listed On Document | |
| Dugan Cathy | $339,900 | None Available |
Source: Public Records
Mortgage History
| Date | Status | Borrower | Loan Amount |
|---|---|---|---|
| Previous Owner | Dugan Cathy | $243,485 |
Source: Public Records
Tax History Compared to Growth
Tax History
| Year | Tax Paid | Tax Assessment Tax Assessment Total Assessment is a certain percentage of the fair market value that is determined by local assessors to be the total taxable value of land and additions on the property. | Land | Improvement |
|---|---|---|---|---|
| 2025 | $6,254 | $158,700 | -- | -- |
| 2024 | $6,254 | $158,700 | -- | -- |
| 2023 | $6,081 | $158,700 | $0 | $0 |
| 2022 | $5,920 | $158,700 | $0 | $0 |
| 2021 | $5,874 | $158,700 | $0 | $0 |
| 2020 | $5,780 | $158,700 | $0 | $0 |
| 2019 | $5,708 | $158,700 | $0 | $0 |
| 2018 | $5,709 | $158,700 | $0 | $0 |
| 2017 | $5,561 | $158,700 | $0 | $0 |
| 2016 | $5,499 | $158,700 | $0 | $0 |
| 2015 | $5,355 | $158,700 | $0 | $0 |
| 2014 | $5,355 | $158,700 | $0 | $0 |
Source: Public Records
Map
Nearby Homes