716 Peach Rd Raleigh, NC 27603
South Raleigh NeighborhoodEstimated Value: $193,252 - $653,000
--
Bed
3
Baths
2,028
Sq Ft
$185/Sq Ft
Est. Value
About This Home
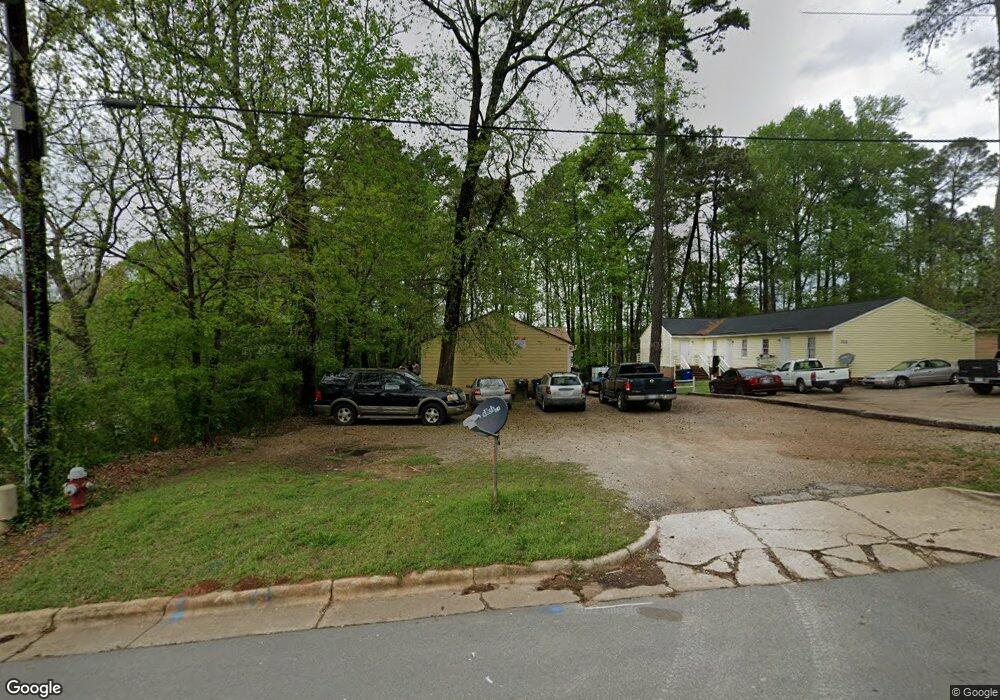
This home is located at 716 Peach Rd, Raleigh, NC 27603 and is currently estimated at $374,751, approximately $184 per square foot. 716 Peach Rd is a home located in Wake County with nearby schools including Salem Elementary, Salem Middle, and Longleaf School Of The Arts.
Ownership History
Date
Name
Owned For
Owner Type
Purchase Details
Closed on
Dec 4, 2014
Sold by
Rodriguez Alfredo and Basurto Maria B
Bought by
Henderson Trinity H and 716 Peach Trust
Current Estimated Value
Purchase Details
Closed on
Sep 19, 2007
Sold by
Consumer Solutions Reo Llc
Bought by
Rodriguez Alfredo C and Basurto Maria B
Home Financials for this Owner
Home Financials are based on the most recent Mortgage that was taken out on this home.
Original Mortgage
$84,000
Interest Rate
6.44%
Mortgage Type
Purchase Money Mortgage
Purchase Details
Closed on
Aug 24, 2007
Sold by
New Century Mortgage Corp
Bought by
Consumer Solutions Reo Llc
Home Financials for this Owner
Home Financials are based on the most recent Mortgage that was taken out on this home.
Original Mortgage
$84,000
Interest Rate
6.44%
Mortgage Type
Purchase Money Mortgage
Purchase Details
Closed on
Nov 27, 2006
Sold by
Whitaker Daryl and Whitaker Pamela H
Bought by
New Century Mortgage Corp
Purchase Details
Closed on
Sep 15, 2006
Sold by
Whitaker Sharl T and Whitaker Lakeesha
Bought by
Whitaker Daryl A
Home Financials for this Owner
Home Financials are based on the most recent Mortgage that was taken out on this home.
Original Mortgage
$119,250
Interest Rate
11.65%
Mortgage Type
Purchase Money Mortgage
Purchase Details
Closed on
Jan 27, 2006
Sold by
Morgane Kendall
Bought by
Whitaker Daryl A and Whitaker Sharl T
Home Financials for this Owner
Home Financials are based on the most recent Mortgage that was taken out on this home.
Original Mortgage
$119,250
Interest Rate
11.65%
Mortgage Type
Fannie Mae Freddie Mac
Purchase Details
Closed on
Jul 12, 2005
Sold by
Stanaway Michael and Stanaway Robin
Bought by
Moragne Kendall
Home Financials for this Owner
Home Financials are based on the most recent Mortgage that was taken out on this home.
Original Mortgage
$80,000
Interest Rate
7.75%
Mortgage Type
Fannie Mae Freddie Mac
Purchase Details
Closed on
Nov 26, 2003
Sold by
Pleasants William L and Pleasants Ann
Bought by
Stanaway Michael and Stanaway Robin
Home Financials for this Owner
Home Financials are based on the most recent Mortgage that was taken out on this home.
Original Mortgage
$78,200
Interest Rate
6.04%
Mortgage Type
Purchase Money Mortgage
Purchase Details
Closed on
May 25, 2001
Sold by
Rooth Gary C and Rooth Nancy M
Bought by
Pleasants William L and Pleasants Ann
Home Financials for this Owner
Home Financials are based on the most recent Mortgage that was taken out on this home.
Original Mortgage
$74,250
Interest Rate
7.02%
Create a Home Valuation Report for This Property
The Home Valuation Report is an in-depth analysis detailing your home's value as well as a comparison with similar homes in the area
Home Values in the Area
Average Home Value in this Area
Purchase History
| Date | Buyer | Sale Price | Title Company |
|---|---|---|---|
| Henderson Trinity H | -- | None Available | |
| Rodriguez Alfredo C | $105,000 | None Available | |
| Consumer Solutions Reo Llc | -- | None Available | |
| New Century Mortgage Corp | $119,600 | None Available | |
| Whitaker Daryl A | -- | None Available | |
| Whitaker Daryl A | $132,500 | None Available | |
| Moragne Kendall | $100,000 | None Available | |
| Stanaway Michael | $92,000 | -- | |
| Pleasants William L | $82,500 | -- |
Source: Public Records
Mortgage History
| Date | Status | Borrower | Loan Amount |
|---|---|---|---|
| Previous Owner | Rodriguez Alfredo C | $84,000 | |
| Previous Owner | Consumer Solutions Reo Llc | $84,000 | |
| Previous Owner | Whitaker Daryl A | $119,250 | |
| Previous Owner | Whitaker Daryl A | $119,250 | |
| Previous Owner | Moragne Kendall | $80,000 | |
| Previous Owner | Stanaway Michael | $78,200 | |
| Previous Owner | Pleasants William L | $74,250 |
Source: Public Records
Tax History Compared to Growth
Tax History
| Year | Tax Paid | Tax Assessment Tax Assessment Total Assessment is a certain percentage of the fair market value that is determined by local assessors to be the total taxable value of land and additions on the property. | Land | Improvement |
|---|---|---|---|---|
| 2025 | $2,060 | $229,287 | $80,000 | $149,287 |
| 2024 | $2,051 | $229,287 | $80,000 | $149,287 |
| 2023 | $1,495 | $131,683 | $28,000 | $103,683 |
| 2022 | $1,393 | $131,683 | $28,000 | $103,683 |
| 2021 | $1,341 | $131,683 | $28,000 | $103,683 |
| 2020 | $1,318 | $131,683 | $28,000 | $103,683 |
| 2019 | $1,300 | $107,017 | $28,000 | $79,017 |
| 2018 | $1,229 | $107,017 | $28,000 | $79,017 |
| 2017 | $1,173 | $107,017 | $28,000 | $79,017 |
| 2016 | $1,150 | $107,017 | $28,000 | $79,017 |
| 2015 | $1,353 | $124,910 | $44,000 | $80,910 |
| 2014 | $1,286 | $124,910 | $44,000 | $80,910 |
Source: Public Records
Map
Nearby Homes
- 412 Stone Flower Ln
- 404 Provincial St
- 409 Provincial St
- 800 Chapanoke Rd
- 1120 Renewal Place Unit 113
- 1120 Renewal Place Unit 111
- 1300 Formal Garden Way
- 1130 Renewal Place Unit 100
- 1314 Still Monument Way
- 1020 Harper Rd
- 831 Historian St
- 1008 Harper Rd
- 1024 Harper Rd
- 513 Dragby Ln
- 1032 Harper Rd
- 1036 Harper Rd
- 1360 Ileagnes Rd
- 3636 Olympia Dr
- 3634 Olympia Dr
- 1229 Chapanoke Rd
- 712 Peach Rd
- 712 Peach Rd Unit 3
- 712 Peach Rd Unit B
- 708 Peach Rd
- 704 Peach Rd
- 2912 Dillwyn Dr
- 717 Peach Rd
- 721 Peach Rd
- 721 Peach Rd Unit D
- 721 Peach Rd Unit B
- 721 Peach Rd Unit C
- 721 Peach Rd Unit A
- 2908 Dillwyn Dr
- 705 Peach Rd
- 701 Peach Rd
- 713 Peach Rd
- 709 Peach Rd
- 608 Peach Rd
- 706 Wexford Dr
- 606 Peach Rd