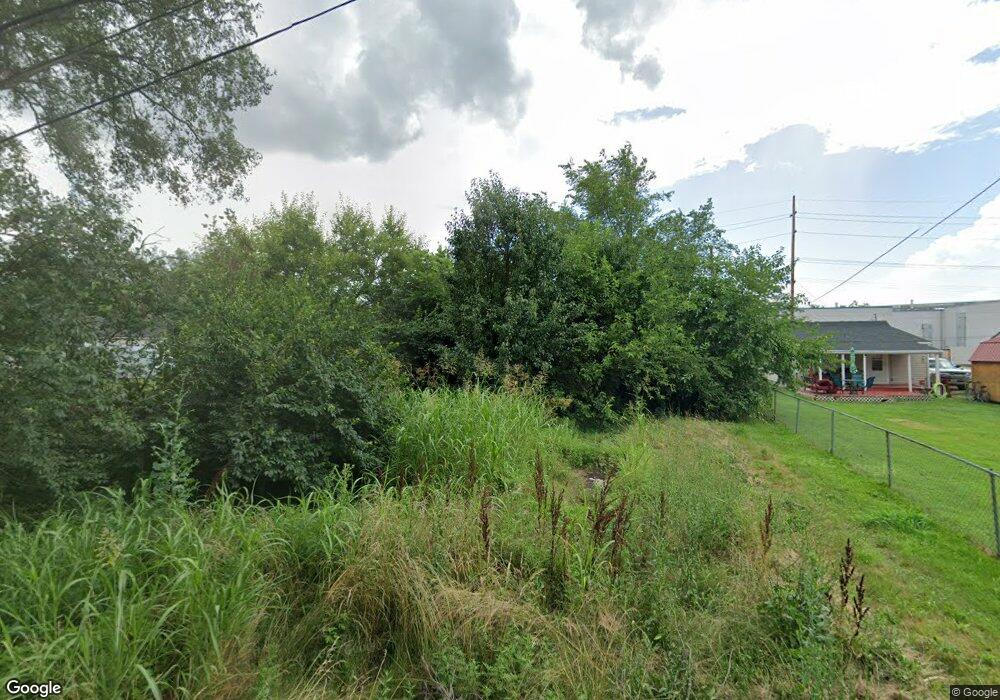
716 South Ave Franklin, OH 45005
Estimated Value: $286,000
Studio
--
Bath
--
Sq Ft
4,008
Sq Ft Lot
About This Home
This home is located at 716 South Ave, Franklin, OH 45005 and is currently estimated at $286,000. 716 South Ave is a home located in Warren County with nearby schools including Franklin High School.
Ownership History
Date
Name
Owned For
Owner Type
Purchase Details
Closed on
Jun 26, 2025
Sold by
Lewis Freda and Bruggeman Freda R
Bought by
Mata Lorelei Llc
Current Estimated Value
Purchase Details
Closed on
Feb 4, 2025
Sold by
Mata Lorelei Llc
Bought by
Lewis Freda R
Purchase Details
Closed on
Oct 29, 2019
Sold by
County Of Warren
Bought by
Mata Lorelei Llc
Purchase Details
Closed on
Jun 27, 2019
Sold by
Abu-Alwafa Mohammad N
Bought by
State Of Ohio
Purchase Details
Closed on
Sep 18, 1997
Sold by
Chasteen Curtis
Bought by
Abdelghani Mohammad N Abu and Abdelghani Alwafa
Purchase Details
Closed on
Jan 28, 1994
Sold by
Taylor Debra S and Taylor Debra S
Bought by
Chasteen and Chasteen Curtis
Purchase Details
Closed on
May 9, 1990
Sold by
Taylor Debra S and Taylor Wesley
Bought by
Taylor and Taylor Debra S
Purchase Details
Closed on
Jul 27, 1989
Sold by
Reedy Edna M and Reedy Edna M
Bought by
Taylor and Taylor Debra S
Purchase Details
Closed on
Apr 12, 1984
Sold by
Paugh Helen K and Paugh Helen K
Bought by
Reedy and Reedy Edna M
Purchase Details
Closed on
Sep 14, 1982
Sold by
Webb Webb and Webb Albert
Purchase Details
Closed on
May 25, 1978
Sold by
Webb Webb and Webb Albert
Create a Home Valuation Report for This Property
The Home Valuation Report is an in-depth analysis detailing your home's value as well as a comparison with similar homes in the area
Home Values in the Area
Average Home Value in this Area
Purchase History
| Date | Buyer | Sale Price | Title Company |
|---|---|---|---|
| Mata Lorelei Llc | -- | None Listed On Document | |
| Lewis Freda R | -- | None Listed On Document | |
| Mata Lorelei Llc | -- | None Available | |
| State Of Ohio | -- | -- | |
| Abdelghani Mohammad N Abu | $2,000 | -- | |
| Chasteen | $20,000 | -- | |
| Taylor | -- | -- | |
| Taylor | -- | -- | |
| Reedy | -- | -- | |
| -- | $13,000 | -- | |
| -- | $600 | -- |
Source: Public Records
Tax History
| Year | Tax Paid | Tax Assessment Tax Assessment Total Assessment is a certain percentage of the fair market value that is determined by local assessors to be the total taxable value of land and additions on the property. | Land | Improvement |
|---|---|---|---|---|
| 2025 | $481 | $660 | $660 | -- |
| 2024 | $481 | $660 | $660 | -- |
| 2023 | $34 | $637 | $637 | $0 |
| 2022 | $34 | $637 | $637 | $0 |
| 2021 | $32 | $637 | $637 | $0 |
| 2020 | $31 | $539 | $539 | $0 |
| 2019 | $27 | $539 | $539 | $0 |
| 2018 | $27 | $539 | $539 | $0 |
| 2017 | $405 | $539 | $539 | $0 |
| 2016 | $31 | $539 | $539 | $0 |
| 2015 | $1,062 | $539 | $539 | $0 |
| 2014 | $31 | $540 | $540 | $0 |
| 2013 | $27 | $600 | $600 | $0 |
Source: Public Records
Map
Nearby Homes
Your Personal Tour Guide
Ask me questions while you tour the home.