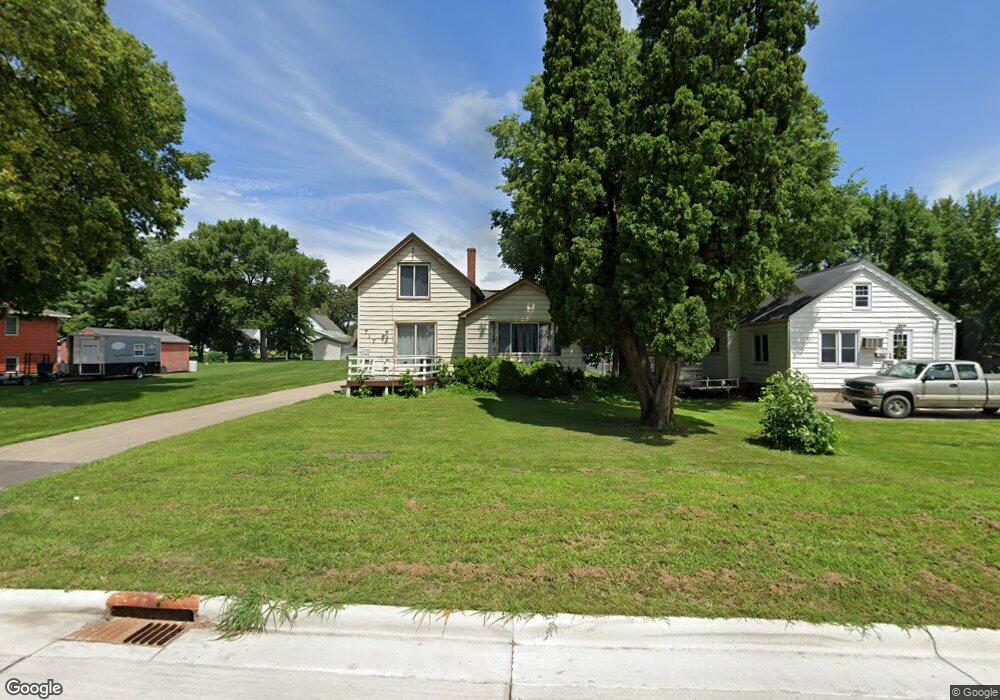
717 8th Ave NE Waseca, MN 56093
Estimated Value: $133,000 - $152,349
2
Beds
1
Bath
816
Sq Ft
$172/Sq Ft
Est. Value
About This Home
This home is located at 717 8th Ave NE, Waseca, MN 56093 and is currently estimated at $140,087, approximately $171 per square foot. 717 8th Ave NE is a home located in Waseca County with nearby schools including Hartley Elementary School, Waseca Intermediate School, and Waseca Junior High School.
Ownership History
Date
Name
Owned For
Owner Type
Purchase Details
Closed on
Feb 10, 2015
Sold by
Huebl Charles J and Huebl Linda
Bought by
Schumann Aaron M
Current Estimated Value
Home Financials for this Owner
Home Financials are based on the most recent Mortgage that was taken out on this home.
Original Mortgage
$63,519
Outstanding Balance
$49,774
Interest Rate
4.4%
Mortgage Type
FHA
Estimated Equity
$90,313
Purchase Details
Closed on
Aug 1, 2012
Sold by
Huebl Charles J and Huebl Linda
Bought by
Schumann Aaron M
Home Financials for this Owner
Home Financials are based on the most recent Mortgage that was taken out on this home.
Original Mortgage
$56,815
Interest Rate
3.65%
Mortgage Type
Balloon
Purchase Details
Closed on
Nov 9, 2011
Sold by
Olson Matthew
Bought by
Huebl Charles J
Purchase Details
Closed on
Apr 10, 2008
Sold by
Federal Home Loan Mortgage Corporation
Bought by
Huebl Charles J
Purchase Details
Closed on
Mar 5, 2008
Sold by
Wells Fargo Bank Na
Bought by
Federal Home Loan Mortgage Corp
Create a Home Valuation Report for This Property
The Home Valuation Report is an in-depth analysis detailing your home's value as well as a comparison with similar homes in the area
Home Values in the Area
Average Home Value in this Area
Purchase History
| Date | Buyer | Sale Price | Title Company |
|---|---|---|---|
| Schumann Aaron M | -- | -- | |
| Schumann Aaron M | $60,000 | -- | |
| Huebl Charles J | -- | -- | |
| Huebl Charles J | $52,500 | -- | |
| Federal Home Loan Mortgage Corp | -- | -- |
Source: Public Records
Mortgage History
| Date | Status | Borrower | Loan Amount |
|---|---|---|---|
| Open | Schumann Aaron M | $63,519 | |
| Closed | Schumann Aaron M | $56,815 |
Source: Public Records
Tax History Compared to Growth
Tax History
| Year | Tax Paid | Tax Assessment Tax Assessment Total Assessment is a certain percentage of the fair market value that is determined by local assessors to be the total taxable value of land and additions on the property. | Land | Improvement |
|---|---|---|---|---|
| 2024 | $1,490 | $124,800 | $31,100 | $93,700 |
| 2023 | $1,478 | $117,700 | $31,100 | $86,600 |
| 2022 | $1,198 | $97,200 | $39,700 | $57,500 |
| 2021 | $1,060 | $84,700 | $34,600 | $50,100 |
| 2020 | $1,006 | $78,300 | $32,000 | $46,300 |
| 2019 | $952 | $74,600 | $30,600 | $44,000 |
| 2018 | $930 | $70,000 | $27,500 | $42,500 |
| 2017 | $830 | $42,000 | $16,500 | $25,500 |
| 2016 | $824 | $40,000 | $15,676 | $24,324 |
| 2015 | -- | $39,000 | $15,300 | $23,700 |
| 2012 | -- | $72,600 | $25,500 | $47,100 |
Source: Public Records
Map
Nearby Homes
- 901 901 Clear Lake Dr
- 901 Clear Lake Dr
- 213 11th Avenue Ct NE
- 414 3rd St NE
- 422 2nd St NE
- 120 4th Ave NE
- 621 Elm Ave E
- 929 929 E Elm Ave
- 929 Elm Ave E
- 117 2nd St NE Unit 120 2nd Ave NE
- 320 9th Ave NW
- 309 12th Ave NW
- 309 309 Nw 12th Ave
- 706 4th Ave SE
- 414 8th St SE
- 1201 4th St NW
- 1208 Elm Ave E
- 412 412 Nw 14th Ave
- 412 14th Ave NW
- 417 12th St SE
- 717 717 8th-Avenue-ne
- 721 8th Ave NE
- 725 8th Ave NE
- 711 8th Ave NE
- 716 716 8th-Avenue-ne
- 716 9th Ave NE
- 725 725 8 Avenue--Ne
- 720 9th Ave NE
- 710 9th Ave NE
- 705 8th Ave NE
- 727 8th Ave NE
- 724 9th Ave NE
- 708 9th Ave NE
- 805 8th St NE
- 720 720 8th-Avenue-ne
- 716 8th Ave NE
- 809 8th St NE
- 801 8th St NE
- 701 8th Ave NE
- 706 9th Ave NE