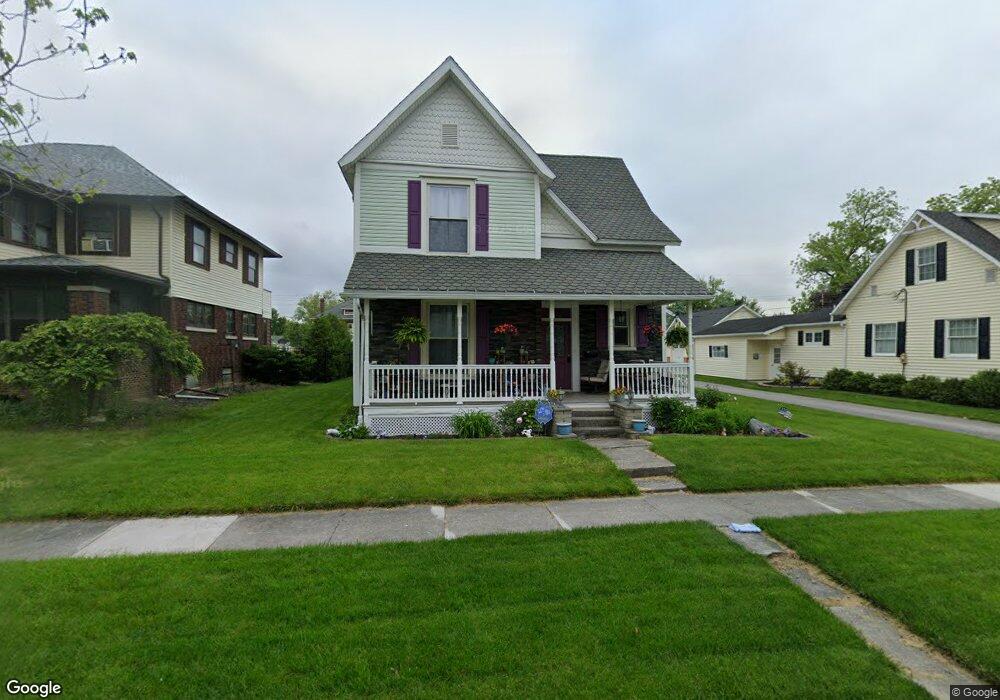
717 E Main St Ottawa, OH 45875
Estimated Value: $279,000 - $324,000
4
Beds
3
Baths
2,794
Sq Ft
$106/Sq Ft
Est. Value
About This Home
This home is located at 717 E Main St, Ottawa, OH 45875 and is currently estimated at $296,265, approximately $106 per square foot. 717 E Main St is a home located in Putnam County with nearby schools including Ottawa-Glandorf High School and Sts. Peter & Paul Catholic School.
Ownership History
Date
Name
Owned For
Owner Type
Purchase Details
Closed on
Oct 31, 2006
Sold by
Harper Hamilton D and Barney Harper Stephanic A
Bought by
Haselman Bart N and Werbeach Sarah R
Current Estimated Value
Home Financials for this Owner
Home Financials are based on the most recent Mortgage that was taken out on this home.
Original Mortgage
$106,000
Outstanding Balance
$61,584
Interest Rate
6.36%
Mortgage Type
New Conventional
Estimated Equity
$234,681
Create a Home Valuation Report for This Property
The Home Valuation Report is an in-depth analysis detailing your home's value as well as a comparison with similar homes in the area
Home Values in the Area
Average Home Value in this Area
Purchase History
| Date | Buyer | Sale Price | Title Company |
|---|---|---|---|
| Haselman Bart N | $127,000 | None Available |
Source: Public Records
Mortgage History
| Date | Status | Borrower | Loan Amount |
|---|---|---|---|
| Open | Haselman Bart N | $106,000 |
Source: Public Records
Tax History
| Year | Tax Paid | Tax Assessment Tax Assessment Total Assessment is a certain percentage of the fair market value that is determined by local assessors to be the total taxable value of land and additions on the property. | Land | Improvement |
|---|---|---|---|---|
| 2025 | $2,343 | $70,820 | $4,290 | $66,530 |
| 2024 | $2,312 | $72,310 | $4,290 | $68,020 |
| 2023 | $2,344 | $53,260 | $3,310 | $49,950 |
| 2022 | $1,956 | $53,260 | $3,311 | $49,949 |
| 2021 | $1,904 | $51,620 | $3,310 | $48,310 |
| 2020 | $1,915 | $55,620 | $2,930 | $52,690 |
| 2019 | $1,709 | $45,920 | $3,310 | $42,610 |
| 2018 | $1,688 | $45,920 | $3,310 | $42,610 |
| 2017 | $2,031 | $45,920 | $3,310 | $42,610 |
| 2016 | $2,031 | $55,620 | $2,930 | $52,690 |
| 2015 | $2,045 | $55,620 | $2,930 | $52,690 |
| 2014 | $2,017 | $55,620 | $2,930 | $52,690 |
| 2013 | $1,946 | $53,870 | $2,930 | $50,940 |
Source: Public Records
Map
Nearby Homes
- 740 E Main St
- 717 E 2nd St
- 370 S Thomas St
- 136 W 3rd St
- 238 N Ohio Ave
- 715 N Perry St
- 1535 E 3rd St
- 1731 S Agner St
- 717 & 717 1/2 & 721 E Third St
- 0 Sapphire St Unit 225029940
- 0 Sapphire St Unit 225046385
- 1823 S Agner St
- 1997 E Main St
- #7 Oakview Dr
- #10 Oakview Dr
- #1 Oakview Dr
- #8 Oakview Dr
- #11 Oakview Dr
- #6 Oakview Dr
- #2 Oakview Dr
Your Personal Tour Guide
Ask me questions while you tour the home.