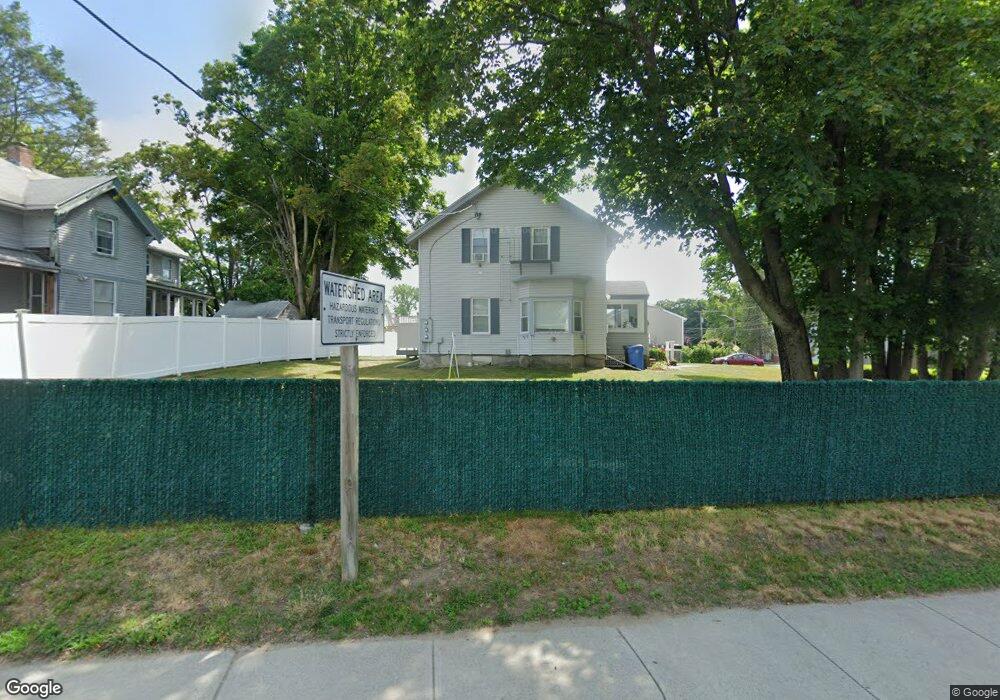
717 High St Cumberland, RI 02864
Valley Falls NeighborhoodEstimated Value: $603,000 - $662,805
6
Beds
3
Baths
2,698
Sq Ft
$236/Sq Ft
Est. Value
About This Home
This home is located at 717 High St, Cumberland, RI 02864 and is currently estimated at $635,951, approximately $235 per square foot. 717 High St is a home located in Providence County with nearby schools including B.F. Norton Elementary School, Joseph L. McCourt Middle School, and Cumberland High School.
Ownership History
Date
Name
Owned For
Owner Type
Purchase Details
Closed on
Oct 10, 2025
Sold by
Ndiaye Mbaye and Coleman-Ndiaye Sandra B
Bought by
Mbaye and Mbaye B S
Current Estimated Value
Purchase Details
Closed on
Sep 19, 2024
Sold by
Campbell Ryan K and Campbell Gabriella A
Bought by
Ndiaye Mbaye and Colemen-Ndiaye Sandra B
Home Financials for this Owner
Home Financials are based on the most recent Mortgage that was taken out on this home.
Original Mortgage
$465,000
Interest Rate
6.47%
Mortgage Type
Purchase Money Mortgage
Create a Home Valuation Report for This Property
The Home Valuation Report is an in-depth analysis detailing your home's value as well as a comparison with similar homes in the area
Home Values in the Area
Average Home Value in this Area
Purchase History
| Date | Buyer | Sale Price | Title Company |
|---|---|---|---|
| Mbaye | -- | -- | |
| Ndiaye Mbaye | $642,000 | None Available | |
| Ndiaye Mbaye | $642,000 | None Available |
Source: Public Records
Mortgage History
| Date | Status | Borrower | Loan Amount |
|---|---|---|---|
| Previous Owner | Ndiaye Mbaye | $465,000 |
Source: Public Records
Tax History Compared to Growth
Tax History
| Year | Tax Paid | Tax Assessment Tax Assessment Total Assessment is a certain percentage of the fair market value that is determined by local assessors to be the total taxable value of land and additions on the property. | Land | Improvement |
|---|---|---|---|---|
| 2025 | $5,587 | $455,300 | $113,000 | $342,300 |
| 2024 | $5,441 | $455,300 | $113,000 | $342,300 |
| 2023 | $5,291 | $455,300 | $113,000 | $342,300 |
| 2022 | $3,996 | $266,600 | $80,400 | $186,200 |
| 2021 | $3,930 | $266,600 | $80,400 | $186,200 |
| 2020 | $3,818 | $266,600 | $80,400 | $186,200 |
| 2019 | $3,217 | $202,600 | $57,500 | $145,100 |
| 2018 | $402 | $202,600 | $57,500 | $145,100 |
| 2017 | $3,082 | $202,600 | $57,500 | $145,100 |
| 2016 | $3,062 | $179,300 | $60,600 | $118,700 |
| 2015 | $3,242 | $189,800 | $71,100 | $118,700 |
| 2014 | $3,242 | $189,800 | $71,100 | $118,700 |
| 2013 | $2,963 | $187,800 | $74,000 | $113,800 |
Source: Public Records
Map
Nearby Homes