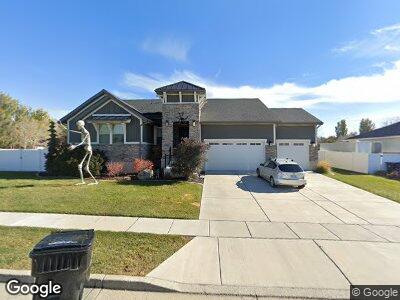
717 S 2200 W Syracuse, UT 84075
Estimated Value: $831,000 - $898,000
4
Beds
5
Baths
4,271
Sq Ft
$201/Sq Ft
Est. Value
About This Home
This home is located at 717 S 2200 W, Syracuse, UT 84075 and is currently estimated at $860,229, approximately $201 per square foot. 717 S 2200 W is a home located in Davis County with nearby schools including Syracuse Elementary School, Syracuse Junior High School, and Syracuse High School.
Ownership History
Date
Name
Owned For
Owner Type
Purchase Details
Closed on
Aug 21, 2019
Sold by
Henderson Kasey J
Bought by
Taylor Curtis and Taylor Jessica Renee
Current Estimated Value
Home Financials for this Owner
Home Financials are based on the most recent Mortgage that was taken out on this home.
Original Mortgage
$388,430
Outstanding Balance
$344,579
Interest Rate
3.7%
Mortgage Type
New Conventional
Estimated Equity
$515,650
Purchase Details
Closed on
Jun 6, 2017
Sold by
Ivory Homes Ltd
Bought by
Henderson Kasey J
Home Financials for this Owner
Home Financials are based on the most recent Mortgage that was taken out on this home.
Original Mortgage
$453,200
Interest Rate
3.97%
Mortgage Type
New Conventional
Create a Home Valuation Report for This Property
The Home Valuation Report is an in-depth analysis detailing your home's value as well as a comparison with similar homes in the area
Home Values in the Area
Average Home Value in this Area
Purchase History
| Date | Buyer | Sale Price | Title Company |
|---|---|---|---|
| Taylor Curtis | -- | Us Title Company | |
| Henderson Kasey J | -- | Cottonwood Title | |
| Ivory Homes Ltd | -- | Cottonwood Title |
Source: Public Records
Mortgage History
| Date | Status | Borrower | Loan Amount |
|---|---|---|---|
| Open | Taylor Curtis | $388,430 | |
| Previous Owner | Henderson Kasey J | $453,200 | |
| Previous Owner | Ivory Homes Ltd | $200,000,000 |
Source: Public Records
Tax History Compared to Growth
Tax History
| Year | Tax Paid | Tax Assessment Tax Assessment Total Assessment is a certain percentage of the fair market value that is determined by local assessors to be the total taxable value of land and additions on the property. | Land | Improvement |
|---|---|---|---|---|
| 2024 | $4,507 | $437,800 | $113,238 | $324,562 |
| 2023 | $4,164 | $737,000 | $157,290 | $579,710 |
| 2022 | $4,484 | $435,050 | $89,368 | $345,682 |
| 2021 | $3,975 | $597,000 | $133,035 | $463,965 |
| 2020 | $3,576 | $520,000 | $111,669 | $408,331 |
| 2019 | $3,838 | $551,000 | $114,333 | $436,667 |
| 2018 | $3,642 | $519,000 | $107,608 | $411,392 |
| 2016 | $3,489 | $260,700 | $41,113 | $219,587 |
| 2015 | $1,106 | $78,685 | $78,685 | $0 |
| 2014 | $1,085 | $78,685 | $78,685 | $0 |
| 2013 | -- | $67,778 | $67,778 | $0 |
Source: Public Records
Map
Nearby Homes