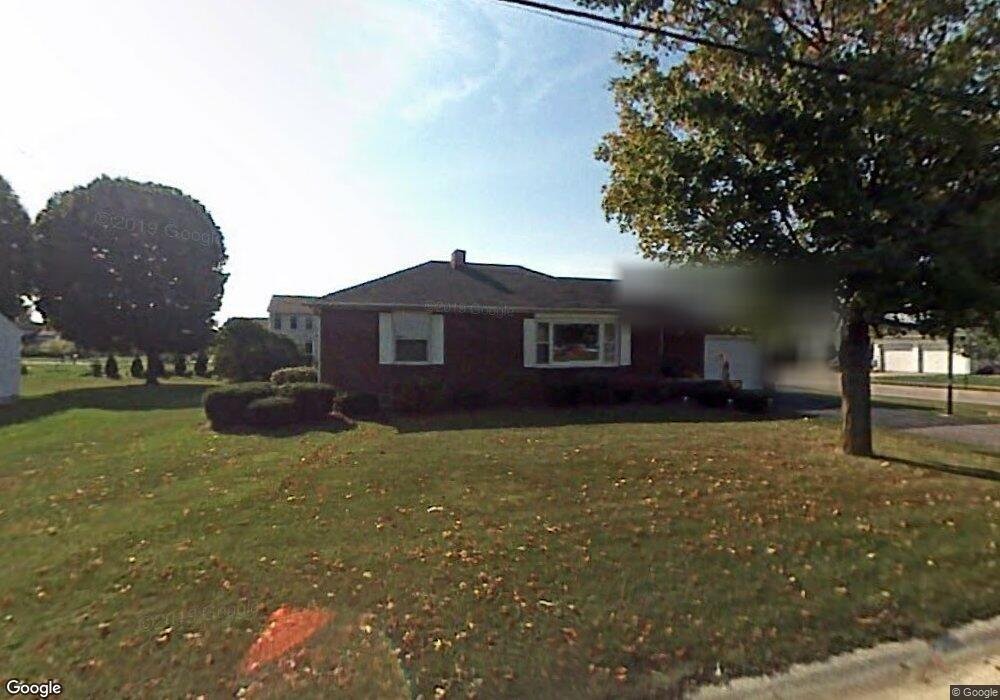
718 W Elmore Eastern Rd Elmore, OH 43416
Estimated Value: $172,000 - $207,000
3
Beds
1
Bath
1,232
Sq Ft
$150/Sq Ft
Est. Value
About This Home
This home is located at 718 W Elmore Eastern Rd, Elmore, OH 43416 and is currently estimated at $184,420, approximately $149 per square foot. 718 W Elmore Eastern Rd is a home located in Ottawa County with nearby schools including Woodmore Elementary School and Woodmore Middle School.
Ownership History
Date
Name
Owned For
Owner Type
Purchase Details
Closed on
Mar 18, 2016
Sold by
Hammel Karen E and Hammel Joseph L
Bought by
Hammel Karen E
Current Estimated Value
Home Financials for this Owner
Home Financials are based on the most recent Mortgage that was taken out on this home.
Original Mortgage
$98,800
Outstanding Balance
$42,613
Interest Rate
3.65%
Mortgage Type
New Conventional
Estimated Equity
$141,807
Purchase Details
Closed on
Jul 7, 2005
Sold by
Lieske Alan P and Lieske Carolyn S
Bought by
St John Karen E
Home Financials for this Owner
Home Financials are based on the most recent Mortgage that was taken out on this home.
Original Mortgage
$118,750
Interest Rate
5.75%
Mortgage Type
Purchase Money Mortgage
Purchase Details
Closed on
Jun 22, 1993
Sold by
Sampson Donald
Bought by
Lenz Warren M and Lenz Pearl J
Create a Home Valuation Report for This Property
The Home Valuation Report is an in-depth analysis detailing your home's value as well as a comparison with similar homes in the area
Home Values in the Area
Average Home Value in this Area
Purchase History
| Date | Buyer | Sale Price | Title Company |
|---|---|---|---|
| Hammel Karen E | -- | Port Lawrence-First Amer Tit | |
| St John Karen E | $125,000 | -- | |
| Lenz Warren M | $75,000 | -- |
Source: Public Records
Mortgage History
| Date | Status | Borrower | Loan Amount |
|---|---|---|---|
| Open | Hammel Karen E | $98,800 | |
| Closed | St John Karen E | $118,750 |
Source: Public Records
Tax History Compared to Growth
Tax History
| Year | Tax Paid | Tax Assessment Tax Assessment Total Assessment is a certain percentage of the fair market value that is determined by local assessors to be the total taxable value of land and additions on the property. | Land | Improvement |
|---|---|---|---|---|
| 2024 | $2,791 | $51,594 | $12,474 | $39,120 |
| 2023 | $2,791 | $48,181 | $18,389 | $29,792 |
| 2022 | $2,755 | $48,181 | $18,389 | $29,792 |
| 2021 | $2,775 | $48,180 | $18,390 | $29,790 |
| 2020 | $1,832 | $30,150 | $4,880 | $25,270 |
| 2019 | $1,808 | $30,150 | $4,880 | $25,270 |
| 2018 | $1,787 | $30,150 | $4,880 | $25,270 |
| 2017 | $1,762 | $29,540 | $4,880 | $24,660 |
| 2016 | $1,723 | $29,540 | $4,880 | $24,660 |
| 2015 | $1,832 | $29,540 | $4,880 | $24,660 |
| 2014 | $900 | $28,200 | $4,880 | $23,320 |
| 2013 | $1,804 | $28,200 | $4,880 | $23,320 |
Source: Public Records
Map
Nearby Homes
- 0 W Portage River Rd S Unit 6130453
- 19383 Courtland Ave
- 20240 W Portage River South Rd
- 620 Water St
- 6201 County Highway 165
- 2574 County Road 74
- 212 S Perry St
- 219 Lime St
- 612 W Main St
- 14878 W State Route 163
- 739 Riverside Dr
- 421 Parklane Dr
- 205 W 4th St
- 571 Parklane Dr
- 136 W Lincoln St
- 114 W Lincoln St
- 207 E 11th St
- 904 Main St
- 3216 U S 20
- 1350 N Genoa Clay Center Rd
- 722 W Elmore Eastern Rd
- 737 Aspen Ave
- 716 W Elmore Eastern Rd
- 719 Aspen Ave
- 750 W Elmore Eastern Rd
- 747 Aspen Ave
- Lot 38 Aspen Ave
- LOT 39 Aspen Ave
- LOT 40 Aspen Ave
- 755 Fremont St
- 739 Fremont St
- 711 Aspen Ave Unit 711
- 0 Aspen Unit 6018329
- 0 Aspen Unit 5083004
- 0 Aspen Unit 20212947
- 0 Aspen Unit 20165681
- 0 Aspen Unit 20150343
- 0 Aspen Avenue - Lot 38 Unit 5110207
- 0 Aspen Unit 5110009
- 0 Aspen Unit 6073865