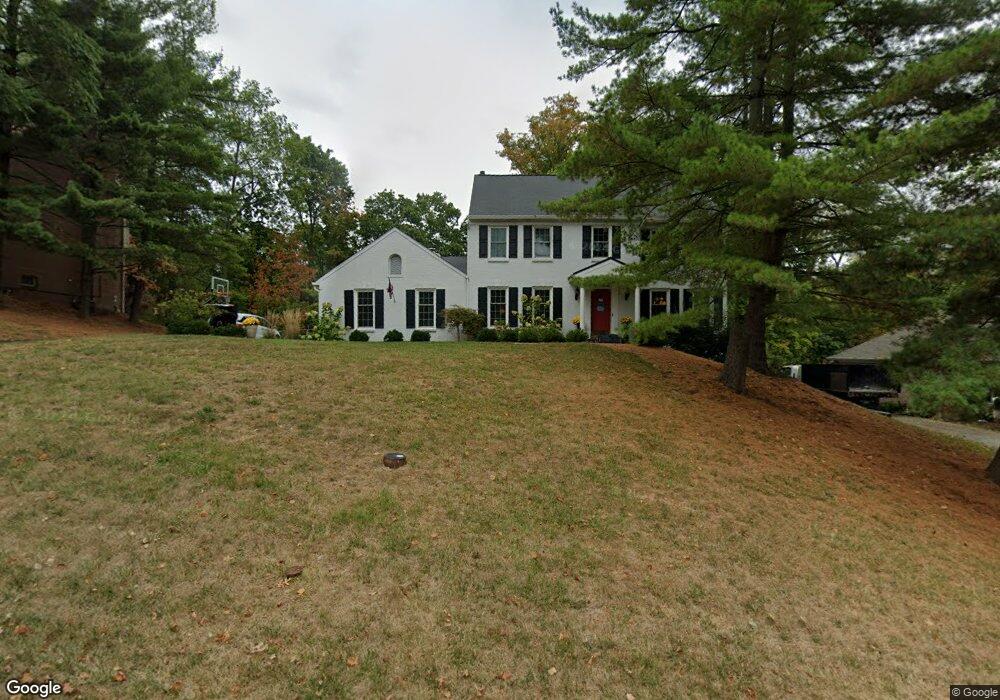
7184 Foxview Dr Cincinnati, OH 45230
Fruit Hill NeighborhoodEstimated Value: $634,000 - $712,000
4
Beds
3
Baths
3,964
Sq Ft
$169/Sq Ft
Est. Value
About This Home
This home is located at 7184 Foxview Dr, Cincinnati, OH 45230 and is currently estimated at $670,787, approximately $169 per square foot. 7184 Foxview Dr is a home located in Hamilton County with nearby schools including Maddux Elementary School, Nagel Middle School, and Anderson High School.
Ownership History
Date
Name
Owned For
Owner Type
Purchase Details
Closed on
Nov 10, 2023
Sold by
Conover Joseph and Conover Dena
Bought by
Conover Joseph L and Conover Dena M
Current Estimated Value
Purchase Details
Closed on
Jun 8, 2010
Sold by
Dickerhoff Bryan and Dickerhoof Tiffany
Bought by
Conover Joseph and Conover Dena
Home Financials for this Owner
Home Financials are based on the most recent Mortgage that was taken out on this home.
Original Mortgage
$249,600
Interest Rate
4.19%
Mortgage Type
New Conventional
Purchase Details
Closed on
Aug 11, 2006
Sold by
Beckett James P and Beckett Jennifer R
Bought by
Dickerhoof Bryan and Dickerhoof Tiffany
Home Financials for this Owner
Home Financials are based on the most recent Mortgage that was taken out on this home.
Original Mortgage
$305,600
Interest Rate
6.25%
Mortgage Type
Unknown
Purchase Details
Closed on
Mar 25, 2005
Sold by
Buchanan Robert Kyle
Bought by
Buchanan Shelley Franz
Purchase Details
Closed on
May 29, 2002
Sold by
Noonan Edmund L and Noonan Anne M
Bought by
Beckett James P and Beckett Jennifer R
Home Financials for this Owner
Home Financials are based on the most recent Mortgage that was taken out on this home.
Original Mortgage
$259,200
Interest Rate
5.75%
Purchase Details
Closed on
Jun 15, 1999
Sold by
Shelley Franz Buchanan
Bought by
Noonan Edmund L and Noonan Anne M
Home Financials for this Owner
Home Financials are based on the most recent Mortgage that was taken out on this home.
Original Mortgage
$210,000
Interest Rate
7.15%
Mortgage Type
Balloon
Purchase Details
Closed on
May 31, 1996
Sold by
Burdine Anthony L and Burdine Brenda F
Bought by
Franz Buchanan Shelley
Home Financials for this Owner
Home Financials are based on the most recent Mortgage that was taken out on this home.
Original Mortgage
$200,000
Interest Rate
7.99%
Create a Home Valuation Report for This Property
The Home Valuation Report is an in-depth analysis detailing your home's value as well as a comparison with similar homes in the area
Home Values in the Area
Average Home Value in this Area
Purchase History
| Date | Buyer | Sale Price | Title Company |
|---|---|---|---|
| Conover Joseph L | -- | None Listed On Document | |
| Conover Joseph | $312,000 | Chicago Title Insurance Co | |
| Dickerhoof Bryan | $382,000 | Landamerica | |
| Buchanan Shelley Franz | -- | None Available | |
| Beckett James P | $324,000 | First Title Agency Inc | |
| Noonan Edmund L | $285,000 | First Title Agency Inc | |
| Franz Buchanan Shelley | $260,000 | -- |
Source: Public Records
Mortgage History
| Date | Status | Borrower | Loan Amount |
|---|---|---|---|
| Previous Owner | Conover Joseph | $249,600 | |
| Previous Owner | Dickerhoof Bryan | $305,600 | |
| Previous Owner | Beckett James P | $259,200 | |
| Previous Owner | Noonan Edmund L | $210,000 | |
| Previous Owner | Franz Buchanan Shelley | $200,000 |
Source: Public Records
Tax History
| Year | Tax Paid | Tax Assessment Tax Assessment Total Assessment is a certain percentage of the fair market value that is determined by local assessors to be the total taxable value of land and additions on the property. | Land | Improvement |
|---|---|---|---|---|
| 2025 | $11,832 | $189,375 | $28,980 | $160,395 |
| 2024 | $11,498 | $189,375 | $28,980 | $160,395 |
| 2023 | $10,937 | $189,375 | $28,980 | $160,395 |
| 2022 | $10,006 | $154,287 | $28,476 | $125,811 |
| 2021 | $9,769 | $154,287 | $28,476 | $125,811 |
| 2020 | $9,882 | $154,287 | $28,476 | $125,811 |
| 2019 | $9,632 | $136,539 | $25,200 | $111,339 |
| 2018 | $9,022 | $136,539 | $25,200 | $111,339 |
| 2017 | $8,508 | $136,539 | $25,200 | $111,339 |
| 2016 | $7,315 | $114,661 | $25,036 | $89,625 |
| 2015 | $7,105 | $114,661 | $25,036 | $89,625 |
| 2014 | $7,109 | $114,661 | $25,036 | $89,625 |
| 2013 | $6,403 | $109,200 | $23,842 | $85,358 |
Source: Public Records
Map
Nearby Homes
- 818 Rosetree Ln
- 965 Woodlyn Dr N
- 771 Woodlyn Dr S Unit 190
- 854 Woodlyn Dr S
- 906 Woodlyn Dr N Unit 4
- 992 Rosetree Ln
- 1132 Rosetree Ln
- 7158 Dunn Rd
- 792 Farmsworth Ct
- 7121 Woodridge Dr
- 7109 Woodridge Dr
- 6811 Sunray St
- 7754 Forest Rd
- 1138 Wilshire Ave
- 987 Chesterton Way
- 1395 Tallberry Dr
- 6756 Sunray Ave
- 881 Asbury Rd
- 6985 Beechmont Ave
- 559 Asbury Rd
- 7190 Foxview Dr
- 7178 Foxview Dr
- 7194 Foxview Dr
- 816 Foxknoll Ct
- 7181 Foxview Dr
- 7187 Foxview Dr
- 7175 Foxview Dr
- 824 Foxknoll Ct
- 7193 Foxview Dr
- 875 Markley Rd
- 7199 Foxview Dr
- 852 Markley Rd
- 7169 Foxview Dr
- 830 Foxknoll Ct
- 815 Foxknoll Ct
- 836 Markley Rd
- 905 Markley Rd
- 7143 Bestview Terrace
- 803 Markley Rd
- 7137 Bestview Terrace
Your Personal Tour Guide
Ask me questions while you tour the home.