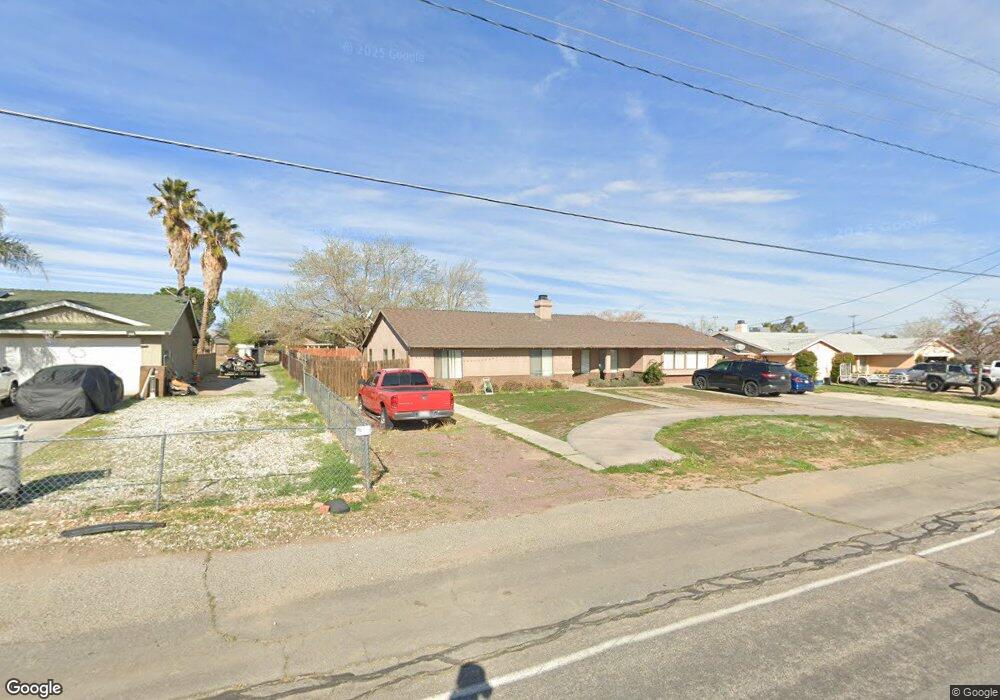
7188 Cottonwood Ave Hesperia, CA 92345
Estimated Value: $492,000 - $566,000
4
Beds
2
Baths
2,162
Sq Ft
$243/Sq Ft
Est. Value
About This Home
This home is located at 7188 Cottonwood Ave, Hesperia, CA 92345 and is currently estimated at $526,333, approximately $243 per square foot. 7188 Cottonwood Ave is a home located in San Bernardino County with nearby schools including Mesquite Trails Elementary School, Cedar Middle School, and Oak Hills High School.
Ownership History
Date
Name
Owned For
Owner Type
Purchase Details
Closed on
Sep 11, 2020
Sold by
Azpericueta Jannetta and Mora Jannette
Bought by
Azpericueta Jannette
Current Estimated Value
Purchase Details
Closed on
Oct 6, 2015
Sold by
Azpericueta Jose Manuel
Bought by
Mora Jannette
Home Financials for this Owner
Home Financials are based on the most recent Mortgage that was taken out on this home.
Original Mortgage
$7,950
Outstanding Balance
$6,234
Interest Rate
3.78%
Mortgage Type
Negative Amortization
Estimated Equity
$520,099
Purchase Details
Closed on
Aug 1, 2015
Sold by
Burton Jeffrey Leonard and Burton Ginger Ann
Bought by
Mora Jannette
Home Financials for this Owner
Home Financials are based on the most recent Mortgage that was taken out on this home.
Original Mortgage
$253,332
Interest Rate
4.5%
Mortgage Type
FHA
Create a Home Valuation Report for This Property
The Home Valuation Report is an in-depth analysis detailing your home's value as well as a comparison with similar homes in the area
Home Values in the Area
Average Home Value in this Area
Purchase History
| Date | Buyer | Sale Price | Title Company |
|---|---|---|---|
| Azpericueta Jannette | -- | Western Resources Title | |
| Mora Jannette | -- | Chicago Title Inland Empire | |
| Mora Jannette | $265,000 | Chicago Title Company |
Source: Public Records
Mortgage History
| Date | Status | Borrower | Loan Amount |
|---|---|---|---|
| Open | Mora Jannette | $7,950 | |
| Previous Owner | Mora Jannette | $253,332 |
Source: Public Records
Tax History Compared to Growth
Tax History
| Year | Tax Paid | Tax Assessment Tax Assessment Total Assessment is a certain percentage of the fair market value that is determined by local assessors to be the total taxable value of land and additions on the property. | Land | Improvement |
|---|---|---|---|---|
| 2025 | $3,619 | $332,066 | $62,741 | $269,325 |
| 2024 | $3,619 | $325,555 | $61,511 | $264,044 |
| 2023 | $3,389 | $301,524 | $60,304 | $241,220 |
| 2022 | $3,310 | $295,612 | $59,122 | $236,490 |
| 2021 | $3,250 | $289,816 | $57,963 | $231,853 |
| 2020 | $3,140 | $286,845 | $57,369 | $229,476 |
| 2019 | $3,074 | $281,220 | $56,244 | $224,976 |
| 2018 | $3,014 | $275,706 | $55,141 | $220,565 |
| 2017 | $2,959 | $270,300 | $54,060 | $216,240 |
| 2016 | $2,895 | $265,000 | $53,000 | $212,000 |
| 2015 | $2,367 | $215,827 | $48,776 | $167,051 |
| 2014 | $2,334 | $211,600 | $47,821 | $163,779 |
Source: Public Records
Map
Nearby Homes
- 7043 Garden Ct
- 15094 Ranchero Rd
- 7164 Kingsley Ave
- 7323 Oakwood Ave
- 6757 Loma Vista Ave
- 14947 Larch St
- 0 Victor St
- 15291 Wells Fargo St
- 6731 Banyan Ave
- 6701 Banyan Ave
- 15345 Farmington St
- 15148 Larch St
- 14587 Mulberry St
- 14624 El Centro St
- 0 Situs Address Unit PW25230513
- 0 Parcel# 0405-042-21-0-000 Unit HD25110608
- 0 Bear Valley Unit HD25248981
- 0 C Ave & Mauna Loa St Unit HD25149622
- Fleming Plan at Laurel at Silverwood
- 111 Starlight Dr
- 7172 Cottonwood Ave
- 7200 Cottonwood Ave
- 14877 Melbourne Ave
- 14897 Melbourne Ave
- 14857 Melbourne Ave
- 7156 Cottonwood Ave
- 7195 Cottonwood Ave
- 7181 Cottonwood Ave
- 14847 Melbourne Ave
- 7167 Cottonwood Ave
- 14831 Melbourne Ct
- 7142 Cottonwood Ave
- 14823 Melbourne Ct
- 7149 Cottonwood Ave
- 14850 Melbourne Ave
- 14837 Melbourne Ct
- 14830 Melbourne Ave
- 14888 Melbourne Ave
- 7135 Cottonwood Ave
- 7254 Cottonwood Ave