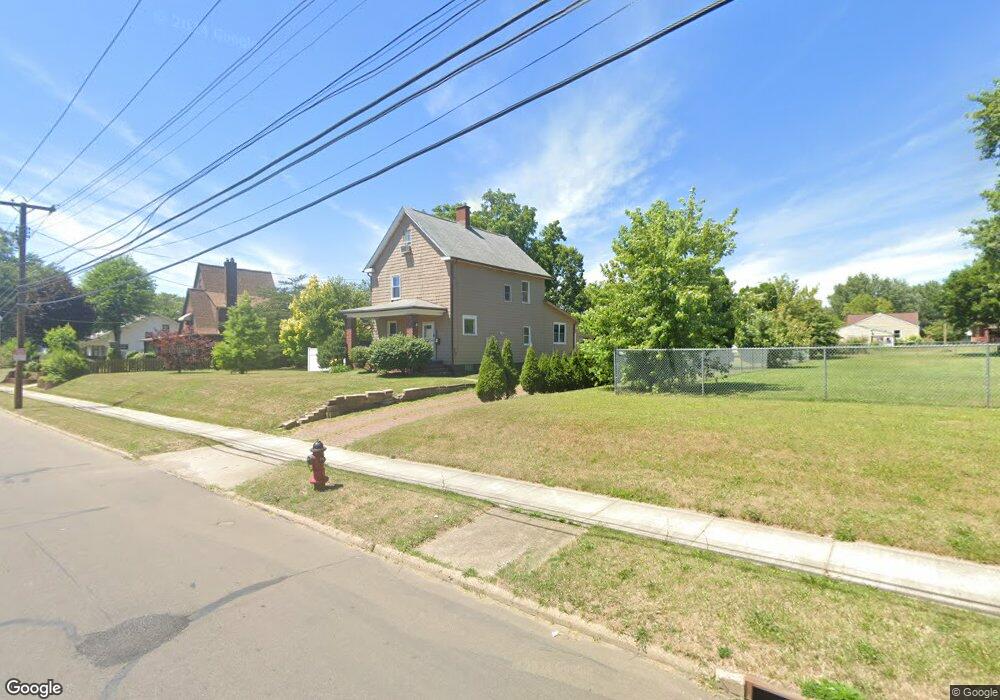
719 19th St NE Canton, OH 44714
Colonial Heights NeighborhoodEstimated Value: $101,000 - $185,083
3
Beds
2
Baths
1,684
Sq Ft
$85/Sq Ft
Est. Value
About This Home
This home is located at 719 19th St NE, Canton, OH 44714 and is currently estimated at $143,521, approximately $85 per square foot. 719 19th St NE is a home located in Stark County with nearby schools including Belle Stone Elementary School, Early Learning Center @ Schreiber, and Youtz Intermediate School.
Ownership History
Date
Name
Owned For
Owner Type
Purchase Details
Closed on
Aug 27, 2003
Sold by
Wells Fargo Bank Minnesota Na
Bought by
Grimm Bobbie J
Current Estimated Value
Home Financials for this Owner
Home Financials are based on the most recent Mortgage that was taken out on this home.
Original Mortgage
$56,000
Outstanding Balance
$25,495
Interest Rate
5.97%
Mortgage Type
Purchase Money Mortgage
Estimated Equity
$118,026
Purchase Details
Closed on
Oct 3, 2002
Sold by
Huntsman Stephen M
Bought by
Wells Fargo Bank Minnesota Na
Purchase Details
Closed on
Aug 29, 2002
Sold by
Huntsman Stephen M and Howell Stacy D
Bought by
Wells Fargo Bank Minnesota Na and Delta Funding Home Equity Loan Trust
Purchase Details
Closed on
Oct 8, 1997
Sold by
Zettler Nancy J
Bought by
Huntsman Stephen M and Howell Stacy
Home Financials for this Owner
Home Financials are based on the most recent Mortgage that was taken out on this home.
Original Mortgage
$51,750
Interest Rate
7.7%
Mortgage Type
New Conventional
Create a Home Valuation Report for This Property
The Home Valuation Report is an in-depth analysis detailing your home's value as well as a comparison with similar homes in the area
Home Values in the Area
Average Home Value in this Area
Purchase History
| Date | Buyer | Sale Price | Title Company |
|---|---|---|---|
| Grimm Bobbie J | $56,000 | -- | |
| Wells Fargo Bank Minnesota Na | $53,200 | -- | |
| Wells Fargo Bank Minnesota Na | $53,200 | -- | |
| Huntsman Stephen M | $68,900 | -- |
Source: Public Records
Mortgage History
| Date | Status | Borrower | Loan Amount |
|---|---|---|---|
| Open | Grimm Bobbie J | $56,000 | |
| Previous Owner | Huntsman Stephen M | $51,750 |
Source: Public Records
Tax History Compared to Growth
Tax History
| Year | Tax Paid | Tax Assessment Tax Assessment Total Assessment is a certain percentage of the fair market value that is determined by local assessors to be the total taxable value of land and additions on the property. | Land | Improvement |
|---|---|---|---|---|
| 2025 | -- | $55,660 | $23,070 | $32,590 |
| 2024 | -- | $55,660 | $23,070 | $32,590 |
| 2023 | $2,295 | $38,370 | $14,880 | $23,490 |
| 2022 | $2,228 | $38,370 | $14,880 | $23,490 |
| 2021 | $2,251 | $38,370 | $14,880 | $23,490 |
| 2020 | $2,021 | $30,840 | $11,970 | $18,870 |
| 2019 | $1,734 | $30,320 | $11,970 | $18,350 |
| 2018 | $1,744 | $30,320 | $11,970 | $18,350 |
| 2017 | $1,815 | $28,710 | $11,340 | $17,370 |
| 2016 | $1,820 | $28,710 | $11,340 | $17,370 |
| 2015 | $1,831 | $28,710 | $11,340 | $17,370 |
| 2014 | $79 | $30,640 | $12,080 | $18,560 |
| 2013 | $999 | $30,640 | $12,080 | $18,560 |
Source: Public Records
Map
Nearby Homes
- 918 19th St NE
- 908 22nd St NE
- 802 17th St NE
- 1126 18th St NE
- 2216 University Ave NW
- 206 21st St NW
- 1219 17th St NE
- 0 Rowland Ave NE Unit 5089960
- 1210 17th St NE
- 1734 Rowland Ave NE
- 1540 Miami Ct NE
- 1625 Market Ave N
- 2219 Rowland Ave NE
- 1521 Gibbs Ave NE
- 1611 Rowland Ave NE
- 120 16th St NW
- 1732 Harvard Ave NW
- 1631 Shriver Ave NE
- 1220 25th St NE
- 211 15th St NE
- 713 19th St NE
- 809 19th St NE
- 1918 Spring Ave NE
- 703 19th St NE
- 901 19th St NE
- 1916 Spring Ave NE
- 808 20th St NE
- 1920 Spring Ave NE
- 806 19th St NE
- 814 20th St NE
- 1926 Spring Ave NE
- 802 20th St NE
- 903 19th St NE
- 812 19th St NE
- 718 20th St NE
- 1932 Spring Ave NE
- 902 19th St NE
- 909 19th St NE
- 521 19th St NE
- 820 20th St NE