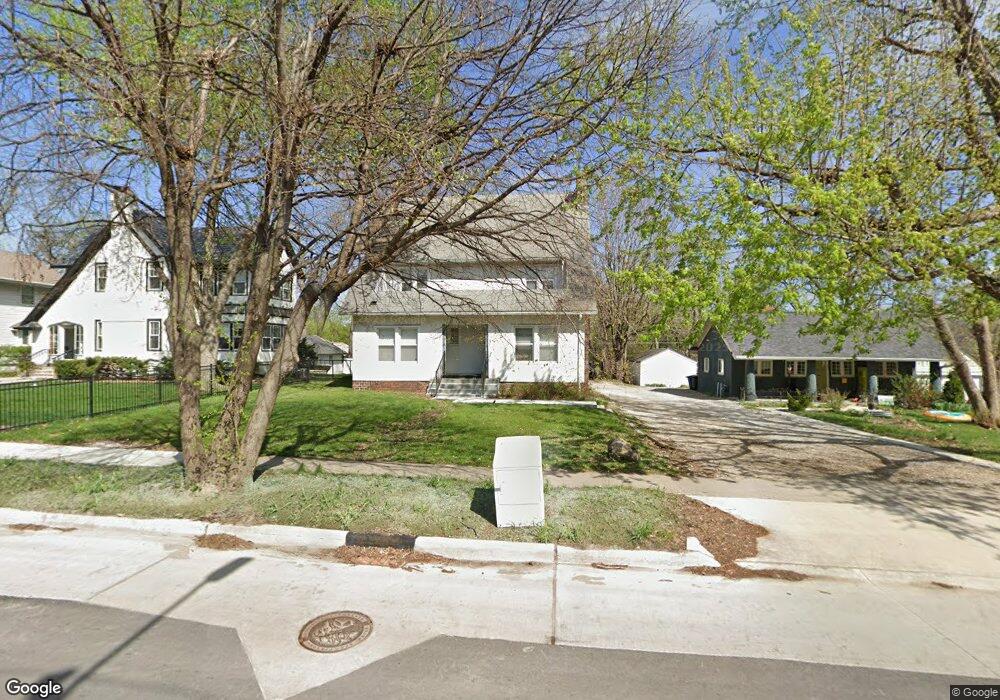
719 35th St Des Moines, IA 50312
North of Grand NeighborhoodEstimated Value: $235,467 - $251,000
4
Beds
2
Baths
2,467
Sq Ft
$99/Sq Ft
Est. Value
About This Home
This home is located at 719 35th St, Des Moines, IA 50312 and is currently estimated at $243,234, approximately $98 per square foot. 719 35th St is a home located in Polk County with nearby schools including Greenwood Elementary School, Callanan Middle School, and Roosevelt High School.
Ownership History
Date
Name
Owned For
Owner Type
Purchase Details
Closed on
Aug 28, 2023
Sold by
Port Energy Llc
Bought by
Munoz Thomas
Current Estimated Value
Home Financials for this Owner
Home Financials are based on the most recent Mortgage that was taken out on this home.
Original Mortgage
$212,087
Interest Rate
7.12%
Mortgage Type
FHA
Purchase Details
Closed on
Oct 10, 2012
Sold by
Schweitzer Helen L
Bought by
Port Energy Llc
Home Financials for this Owner
Home Financials are based on the most recent Mortgage that was taken out on this home.
Original Mortgage
$85,600
Interest Rate
3.57%
Mortgage Type
Future Advance Clause Open End Mortgage
Create a Home Valuation Report for This Property
The Home Valuation Report is an in-depth analysis detailing your home's value as well as a comparison with similar homes in the area
Home Values in the Area
Average Home Value in this Area
Purchase History
| Date | Buyer | Sale Price | Title Company |
|---|---|---|---|
| Munoz Thomas | $216,000 | None Listed On Document | |
| Munoz Thomas | $216,000 | None Listed On Document | |
| Port Energy Llc | $107,000 | None Available |
Source: Public Records
Mortgage History
| Date | Status | Borrower | Loan Amount |
|---|---|---|---|
| Previous Owner | Munoz Thomas | $212,087 | |
| Previous Owner | Port Energy Llc | $85,600 |
Source: Public Records
Tax History
| Year | Tax Paid | Tax Assessment Tax Assessment Total Assessment is a certain percentage of the fair market value that is determined by local assessors to be the total taxable value of land and additions on the property. | Land | Improvement |
|---|---|---|---|---|
| 2025 | $4,284 | $227,500 | $51,900 | $175,600 |
| 2024 | $4,284 | $217,800 | $49,500 | $168,300 |
| 2023 | $4,042 | $217,800 | $49,500 | $168,300 |
| 2022 | $4,012 | $171,500 | $41,000 | $130,500 |
| 2021 | $3,828 | $171,500 | $41,000 | $130,500 |
| 2020 | $3,976 | $153,400 | $36,800 | $116,600 |
| 2019 | $3,504 | $153,400 | $36,800 | $116,600 |
| 2018 | $3,468 | $130,400 | $32,900 | $97,500 |
| 2017 | $3,200 | $130,400 | $32,900 | $97,500 |
| 2016 | $3,118 | $118,300 | $29,500 | $88,800 |
| 2015 | $3,118 | $118,300 | $29,500 | $88,800 |
| 2014 | $2,898 | $113,200 | $28,100 | $85,100 |
Source: Public Records
Map
Nearby Homes
- 676 34th St
- 727 37th St
- 636 35th St
- 3621 Woodland Ave
- 3117 Pleasant St
- 710 31st St
- 630 36th St
- 684 31st St
- 3516 Iola Ave
- 3308 Crescent Dr
- 3206 Iola Ave
- 3001 Center St
- 3406 School St
- 725 40th St
- 2928 High St
- 505 36th St Unit 302
- 3663 Grand Ave Unit 1004
- 3663 Grand Ave Unit 106
- 3663 Grand Ave Unit 104
- 3663 Grand Ave Unit 501
Your Personal Tour Guide
Ask me questions while you tour the home.