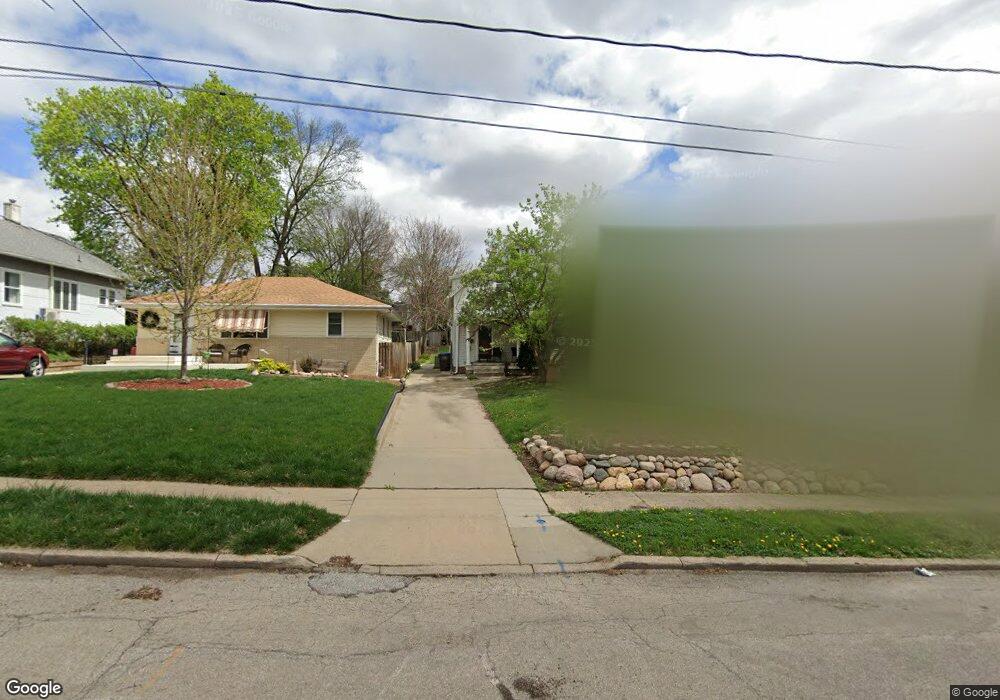
719 39th St Des Moines, IA 50312
North of Grand NeighborhoodEstimated Value: $200,000 - $230,000
3
Beds
1
Bath
1,307
Sq Ft
$166/Sq Ft
Est. Value
About This Home
This home is located at 719 39th St, Des Moines, IA 50312 and is currently estimated at $216,790, approximately $165 per square foot. 719 39th St is a home located in Polk County with nearby schools including Hubbell Elementary, Roosevelt High School, and Bergman Academy.
Ownership History
Date
Name
Owned For
Owner Type
Purchase Details
Closed on
Jun 8, 2011
Sold by
Phillips David W and Phillips Jami D
Bought by
Streiber Shirley L
Current Estimated Value
Home Financials for this Owner
Home Financials are based on the most recent Mortgage that was taken out on this home.
Original Mortgage
$70,400
Outstanding Balance
$45,091
Interest Rate
3.25%
Mortgage Type
Adjustable Rate Mortgage/ARM
Estimated Equity
$171,699
Purchase Details
Closed on
Apr 10, 1997
Sold by
Ridnour Ed and Ridnour Jane
Bought by
Phillips David W and Phillips Jami D
Home Financials for this Owner
Home Financials are based on the most recent Mortgage that was taken out on this home.
Original Mortgage
$60,000
Interest Rate
7.74%
Create a Home Valuation Report for This Property
The Home Valuation Report is an in-depth analysis detailing your home's value as well as a comparison with similar homes in the area
Home Values in the Area
Average Home Value in this Area
Purchase History
| Date | Buyer | Sale Price | Title Company |
|---|---|---|---|
| Streiber Shirley L | $87,500 | None Available | |
| Phillips David W | $78,500 | -- |
Source: Public Records
Mortgage History
| Date | Status | Borrower | Loan Amount |
|---|---|---|---|
| Open | Streiber Shirley L | $70,400 | |
| Previous Owner | Phillips David W | $60,000 |
Source: Public Records
Tax History Compared to Growth
Tax History
| Year | Tax Paid | Tax Assessment Tax Assessment Total Assessment is a certain percentage of the fair market value that is determined by local assessors to be the total taxable value of land and additions on the property. | Land | Improvement |
|---|---|---|---|---|
| 2025 | $3,636 | $206,800 | $49,800 | $157,000 |
| 2024 | $3,636 | $184,800 | $44,200 | $140,600 |
| 2023 | $4,012 | $184,800 | $44,200 | $140,600 |
| 2022 | $3,980 | $170,200 | $42,000 | $128,200 |
| 2021 | $3,866 | $170,200 | $42,000 | $128,200 |
| 2020 | $4,016 | $154,900 | $38,300 | $116,600 |
| 2019 | $3,612 | $154,900 | $38,300 | $116,600 |
| 2018 | $3,576 | $134,400 | $33,100 | $101,300 |
| 2017 | $3,218 | $134,400 | $33,100 | $101,300 |
| 2016 | $3,136 | $119,000 | $29,100 | $89,900 |
| 2015 | $3,136 | $119,000 | $29,100 | $89,900 |
| 2014 | $2,890 | $112,900 | $27,600 | $85,300 |
Source: Public Records
Map
Nearby Homes