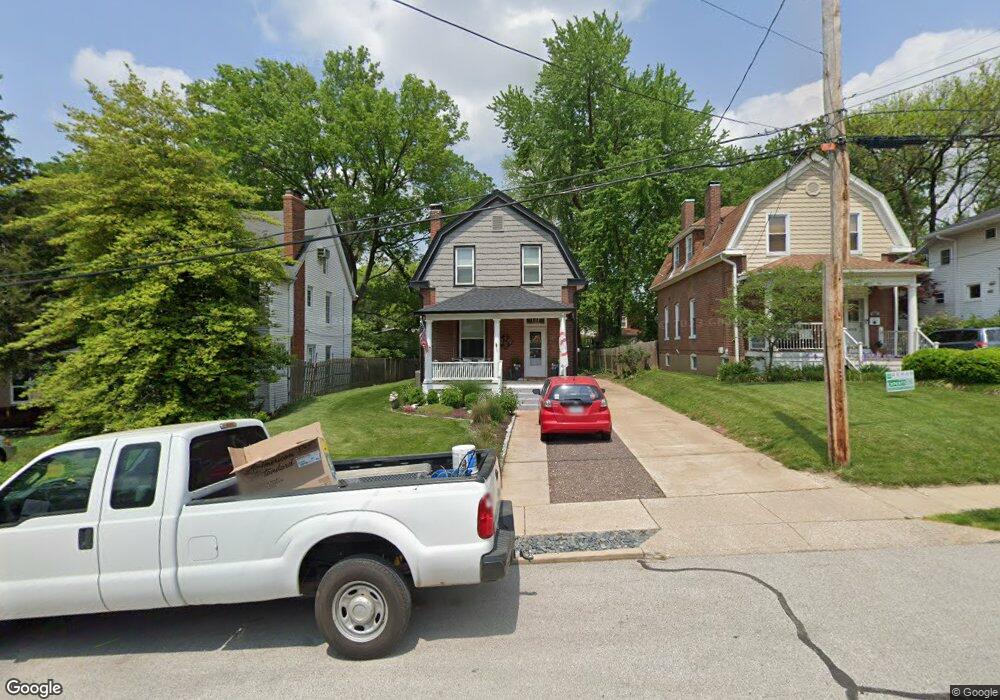
719 Clark Ave Webster Groves, MO 63119
Estimated Value: $374,000 - $428,613
3
Beds
2
Baths
1,545
Sq Ft
$265/Sq Ft
Est. Value
About This Home
This home is located at 719 Clark Ave, Webster Groves, MO 63119 and is currently estimated at $408,653, approximately $264 per square foot. 719 Clark Ave is a home located in St. Louis County with nearby schools including Avery Elementary School, Hixson Middle School, and Webster Groves High School.
Ownership History
Date
Name
Owned For
Owner Type
Purchase Details
Closed on
Jul 13, 2021
Sold by
Brader David C and Brader Molly E
Bought by
Brader David C and Brader Molly E
Current Estimated Value
Purchase Details
Closed on
Jul 25, 2019
Sold by
Brader David C
Bought by
Brader David C and Clark Molly E
Home Financials for this Owner
Home Financials are based on the most recent Mortgage that was taken out on this home.
Original Mortgage
$230,000
Interest Rate
3.82%
Mortgage Type
Commercial
Purchase Details
Closed on
Feb 20, 2019
Sold by
The Joan P Harre Revocable Trust
Bought by
Brader David C
Home Financials for this Owner
Home Financials are based on the most recent Mortgage that was taken out on this home.
Original Mortgage
$210,000
Interest Rate
4.4%
Mortgage Type
Future Advance Clause Open End Mortgage
Purchase Details
Closed on
Jun 15, 2016
Sold by
Harre Joan P
Bought by
Harre Joan P
Create a Home Valuation Report for This Property
The Home Valuation Report is an in-depth analysis detailing your home's value as well as a comparison with similar homes in the area
Home Values in the Area
Average Home Value in this Area
Purchase History
| Date | Buyer | Sale Price | Title Company |
|---|---|---|---|
| Brader David C | -- | None Available | |
| Brader David C | -- | None Available | |
| Brader David C | $200,000 | Copper Title Llc | |
| Harre Joan P | -- | None Available |
Source: Public Records
Mortgage History
| Date | Status | Borrower | Loan Amount |
|---|---|---|---|
| Closed | Brader David C | $230,000 | |
| Closed | Brader David C | $210,000 |
Source: Public Records
Tax History Compared to Growth
Tax History
| Year | Tax Paid | Tax Assessment Tax Assessment Total Assessment is a certain percentage of the fair market value that is determined by local assessors to be the total taxable value of land and additions on the property. | Land | Improvement |
|---|---|---|---|---|
| 2025 | $4,336 | $64,580 | $41,590 | $22,990 |
| 2024 | $4,336 | $62,170 | $30,250 | $31,920 |
| 2023 | $4,314 | $62,170 | $30,250 | $31,920 |
| 2022 | $3,898 | $52,100 | $30,250 | $21,850 |
| 2021 | $3,884 | $52,100 | $30,250 | $21,850 |
| 2020 | $4,159 | $52,020 | $30,250 | $21,770 |
| 2019 | $4,130 | $52,020 | $30,250 | $21,770 |
| 2018 | $4,100 | $45,870 | $21,190 | $24,680 |
| 2017 | $4,073 | $45,870 | $21,190 | $24,680 |
| 2016 | $3,702 | $39,890 | $18,150 | $21,740 |
| 2015 | $3,716 | $39,890 | $18,150 | $21,740 |
| 2014 | $3,361 | $35,080 | $13,020 | $22,060 |
Source: Public Records
Map
Nearby Homes
- 706 Atalanta Ave
- 685 Clark Ave
- 619 N Bompart Ave
- 604 Atalanta Ave
- 808 Greeley Ave
- 544 Summit Ave
- 610 Cornelia Ave
- 817 N Forest Ave
- 835 N Forest Ave
- 804 E Pacific Ave
- 874 Tuxedo Blvd
- 511 Fairview Ave
- 946 Newport Ave
- 1016 Marshall Ave
- 441 Park Rd
- 570 N Laclede Station Rd
- 554 N Laclede Station Rd
- 1048 Kuhlman Ln
- 1052 Kuhlman Ln
- 1045 Tuxedo Blvd
- 721 Clark Ave
- 715 Clark Ave
- 725 Clark Ave
- 709 Clark Ave
- 716 Atalanta Ave
- 735 Clark Ave
- 707 Clark Ave
- 722 Atalanta Ave
- 714 Atalanta Ave
- 710 Atalanta Ave
- 726 Atalanta Ave
- 737 Clark Ave
- 701 Clark Ave
- 716 Clark Ave
- 730 Atalanta Ave
- 720 Clark Ave
- 714 Clark Ave
- 726 Clark Ave
- 710 Clark Ave
- 732 Atalanta Ave