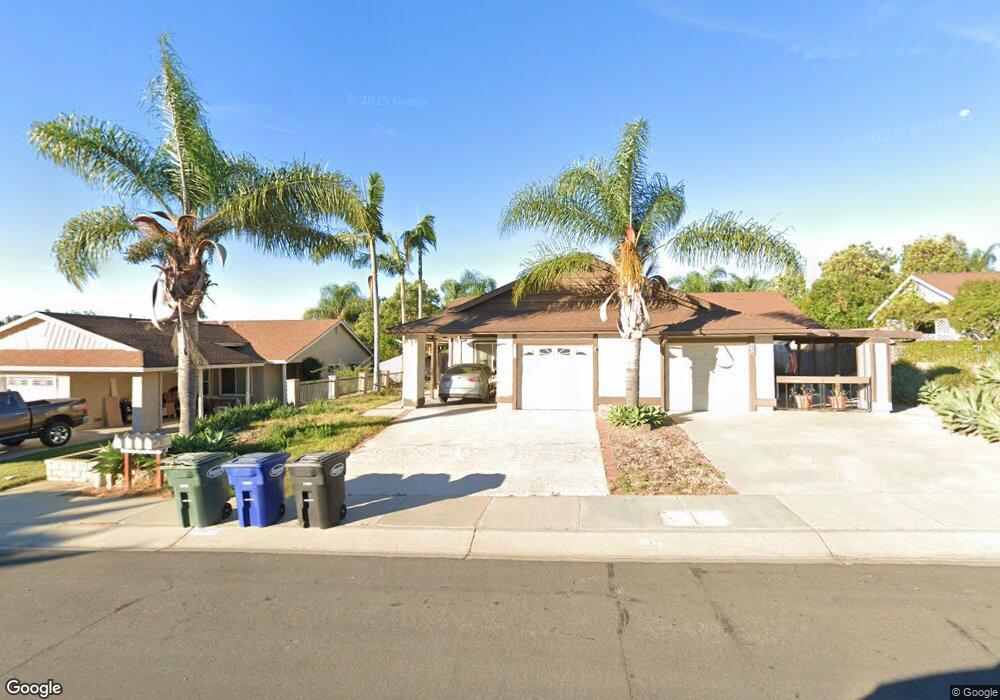
719 Hillcrest Dr Camarillo, CA 93012
Estimated Value: $640,719 - $729,000
3
Beds
2
Baths
1,058
Sq Ft
$659/Sq Ft
Est. Value
About This Home
This home is located at 719 Hillcrest Dr, Camarillo, CA 93012 and is currently estimated at $697,430, approximately $659 per square foot. 719 Hillcrest Dr is a home located in Ventura County with nearby schools including La Mariposa Elementary School, Las Colinas Middle School, and Adolfo Camarillo High School.
Ownership History
Date
Name
Owned For
Owner Type
Purchase Details
Closed on
Sep 3, 2020
Sold by
Barnes Leslie Lynn and Barnes Trust
Bought by
Barnes Blakeslee Alan
Current Estimated Value
Home Financials for this Owner
Home Financials are based on the most recent Mortgage that was taken out on this home.
Original Mortgage
$430,400
Outstanding Balance
$381,952
Interest Rate
2.9%
Mortgage Type
New Conventional
Estimated Equity
$315,478
Purchase Details
Closed on
May 15, 2003
Sold by
Barnes Leslie Lynn
Bought by
Barnes Leslie Lynn
Purchase Details
Closed on
Nov 11, 1997
Sold by
Meredith Leslie O
Bought by
Barnes Leslie Lynn
Home Financials for this Owner
Home Financials are based on the most recent Mortgage that was taken out on this home.
Original Mortgage
$133,790
Interest Rate
8.5%
Create a Home Valuation Report for This Property
The Home Valuation Report is an in-depth analysis detailing your home's value as well as a comparison with similar homes in the area
Home Values in the Area
Average Home Value in this Area
Purchase History
| Date | Buyer | Sale Price | Title Company |
|---|---|---|---|
| Barnes Blakeslee Alan | $538,000 | Lawyers Title Vn | |
| Barnes Leslie Lynn | -- | -- | |
| Barnes Leslie Lynn | $157,500 | Old Republic Title Company |
Source: Public Records
Mortgage History
| Date | Status | Borrower | Loan Amount |
|---|---|---|---|
| Open | Barnes Blakeslee Alan | $430,400 | |
| Previous Owner | Barnes Leslie Lynn | $133,790 | |
| Closed | Barnes Leslie Lynn | $18,888 |
Source: Public Records
Tax History
| Year | Tax Paid | Tax Assessment Tax Assessment Total Assessment is a certain percentage of the fair market value that is determined by local assessors to be the total taxable value of land and additions on the property. | Land | Improvement |
|---|---|---|---|---|
| 2025 | $2,718 | $251,293 | $100,517 | $150,776 |
| 2024 | $2,718 | $246,366 | $98,546 | $147,820 |
| 2023 | $2,620 | $241,536 | $96,614 | $144,922 |
| 2022 | $2,610 | $236,800 | $94,719 | $142,081 |
| 2021 | $2,516 | $232,157 | $92,861 | $139,296 |
| 2020 | $2,506 | $229,779 | $91,910 | $137,869 |
| 2019 | $2,493 | $225,274 | $90,108 | $135,166 |
| 2018 | $2,446 | $220,858 | $88,342 | $132,516 |
| 2017 | $2,304 | $216,528 | $86,610 | $129,918 |
| 2016 | $2,248 | $212,283 | $84,912 | $127,371 |
| 2015 | $2,223 | $209,096 | $83,638 | $125,458 |
| 2014 | $2,171 | $205,001 | $82,000 | $123,001 |
Source: Public Records
Map
Nearby Homes
- 499 Sobre Colinas Place
- 4696 Refugio Ct
- 27 Tahquitz Dr Unit 226
- 59 Caleta Dr Unit 177
- 18 Tahquitz Ct Unit 217
- 50 Tahquitz Ct Unit 249
- 182 Rancho Adolfo Dr Unit 83
- 14 Tahquitz Ct Unit 213
- 74 Caleta Dr Unit 162
- 207 Caleta Dr Unit 98
- 8 Calle Fronte Unit 204
- 395 Via Cantilena
- 472 Via Olivera
- 222 Calle Fronte Unit 29
- 353 Via Cantilena Unit 87
- 161 Tahquitz Dr Unit 35
- 5200 Prairieview St
- 231 Calle Orovista
- 1329 La Culebra Cir
- 5211 Village 5
- 729 Hillcrest Dr
- 709 Hillcrest Dr
- 737 Hillcrest Dr
- 701 Hillcrest Dr
- 784 Aliento Way
- 745 Hillcrest Dr
- 689 Hillcrest Dr
- 4787 Aqua Verde Ct
- 728 Hillcrest Dr
- 720 Hillcrest Dr
- 755 Hillcrest Dr
- 679 Hillcrest Dr
- 791 Aliento Way
- 712 Hillcrest Dr
- 738 Hillcrest Dr
- 776 Aliento Way
- 702 Hillcrest Dr
- 748 Hillcrest Dr
- 4761 Aqua Verde Ct
- 667 Hillcrest Dr
Your Personal Tour Guide
Ask me questions while you tour the home.