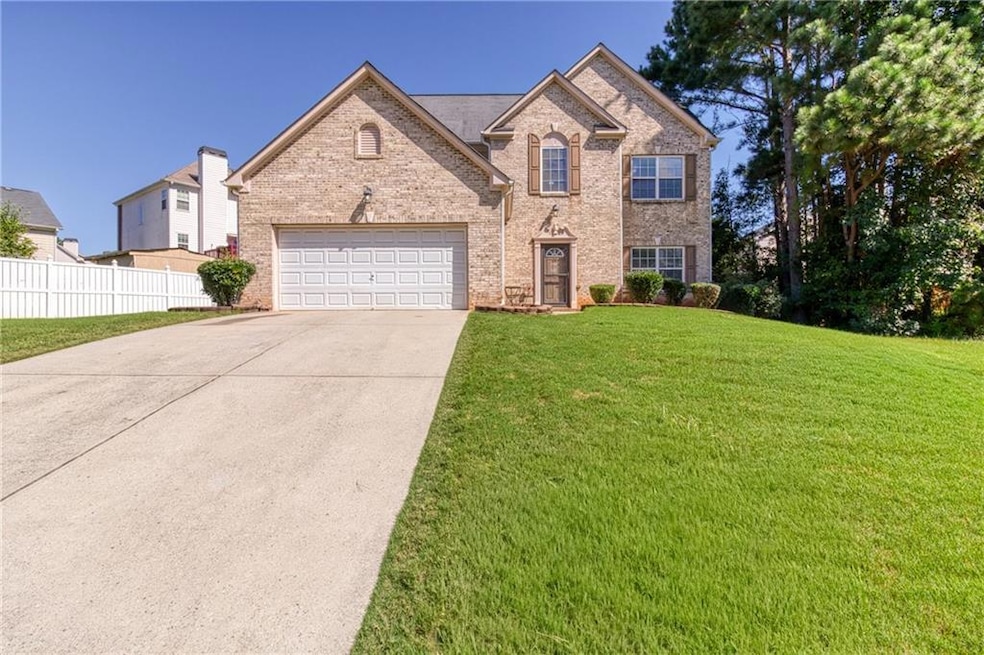
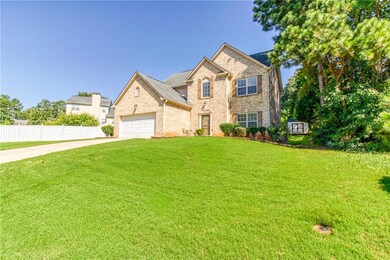
719 Nightwind Way Stockbridge, GA 30281
Estimated payment $2,100/month
Highlights
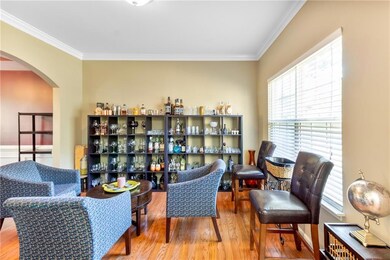
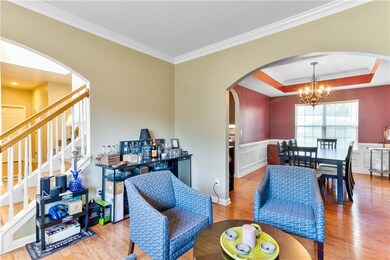
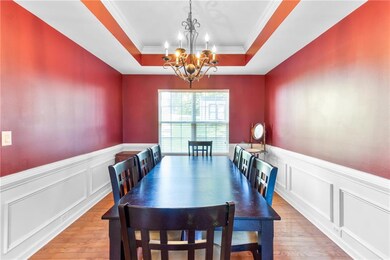
- Open-Concept Dining Room
- Community Lake
- Traditional Architecture
- Home Energy Rating Service (HERS) Rated Property
- Clubhouse
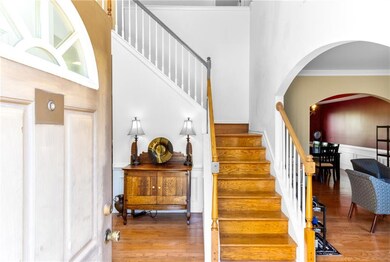
- Wood Flooring
About This Home
THIS HOME QUALIFIES FOR $10,000 FIRST TIME HOMEBUYER PROGRAM. SELLER IS OFFERING CONCESSIONS TOWARDS CLOSING COSTS AND THE HOME IS PRICED SHY OF MARKET VALUE, GUARANTEEING A WALK-IN TO EQUITY. SELLER IS MOTIVATED! THIS IS A GREAT OPPORTUNITY ALL AROUND IN A GREAT COMMUNITY!
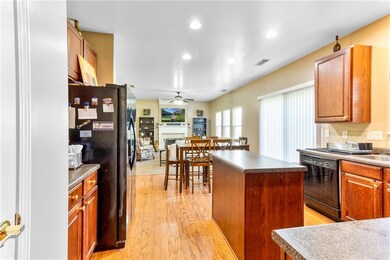
Step into this well maintained 3-bedroom, 2.5-bathroom home in sought-after Monarch Village, where versatile spaces and thoughtful upgrades make everyday living a pleasure. On the main level, the spacious living room with a cozy fireplace sets the tone for relaxing nights in, while across the hall sits the traditional formal sitting and dining room. These rooms can be utilized as originally crafted or expand into custom entertaining or creative spaces. A convenient half bath is also located downstairs. Upstairs, the primary suite is a true retreat. The spacious bedroom is equipped with additional sitting room to be utilized as sun room, office space or private lounging area. The ensuite bathroom offers dual sinks, while the upstairs hall bath also includes double vanities, making mornings easy for the whole household. Multiple closets throughout the home provide even more storage options. Recent updates include newly replaced AC units, giving peace of mind and efficiency. Out back, the gently sloped yard is perfect for playtime, and a new-installed shed provides practical storage for lawn equipment or hobbies. As a bonus, the community, Monarch Village, offers walking trails, tennis courts, and a resort-style pool, with Henry County’s growing shopping, dining, and schools just minutes away.
Schedule your tour of 719 Nightwind Way today and see how this house fits your lifestyle!

Home Details
Home Type
- Single Family
Est. Annual Taxes
- $4,300
Year Built
- Built in 2004
Lot Details
- 8,790 Sq Ft Lot
- Back Yard
HOA Fees
- $57 Monthly HOA Fees
Parking
- 1 Car Garage
Home Design
- Traditional Architecture
- Slab Foundation
- Shingle Roof
- Vinyl Siding
- Brick Front
Interior Spaces
- 2,274 Sq Ft Home
- 2-Story Property
- Double Pane Windows
- Entrance Foyer
- Living Room with Fireplace
- Open-Concept Dining Room
- Sun or Florida Room
- Neighborhood Views
- Laundry on main level
Kitchen
- Electric Range
- Dishwasher
- Kitchen Island
Flooring
- Wood
- Carpet
- Tile
Bedrooms and Bathrooms
- 3 Bedrooms
- Split Bedroom Floorplan
- Dual Vanity Sinks in Primary Bathroom
- Whirlpool Bathtub
Home Security
- Carbon Monoxide Detectors
- Fire and Smoke Detector
Eco-Friendly Details
- Home Energy Rating Service (HERS) Rated Property
- HERS Index Rating of 150 | Home has major energy problems
Outdoor Features
- Shed
- Rear Porch
Location
- Property is near schools
Schools
- Red Oak Elementary School
- Dutchtown Middle School
- Dutchtown High School
Utilities
- Central Air
- Heating Available
- 220 Volts
- Cable TV Available
Listing and Financial Details
- Assessor Parcel Number 031J01169000
Community Details
Overview
- Built by Quality Craftsmen, LLC
- Preserve Monarch Subdivision
- Community Lake
Amenities
- Clubhouse
Recreation
- Tennis Courts
- Community Pool
- Community Spa
- Park
- Dog Park
Map
Home Values in the Area
Average Home Value in this Area
Tax History
| Year | Tax Paid | Tax Assessment Tax Assessment Total Assessment is a certain percentage of the fair market value that is determined by local assessors to be the total taxable value of land and additions on the property. | Land | Improvement |
|---|---|---|---|---|
| 2025 | $4,377 | $131,240 | $18,000 | $113,240 |
| 2024 | $4,377 | $124,840 | $18,000 | $106,840 |
| 2023 | $4,011 | $130,800 | $14,000 | $116,800 |
| 2022 | $3,591 | $106,600 | $14,000 | $92,600 |
| 2021 | $3,089 | $85,400 | $12,000 | $73,400 |
| 2020 | $2,915 | $78,040 | $10,000 | $68,040 |
| 2019 | $2,806 | $76,080 | $10,000 | $66,080 |
| 2018 | $2,588 | $70,280 | $10,000 | $60,280 |
| 2016 | $2,337 | $63,720 | $10,000 | $53,720 |
| 2015 | $2,008 | $53,920 | $6,000 | $47,920 |
| 2014 | $1,787 | $47,920 | $4,680 | $43,240 |
Property History
| Date | Event | Price | List to Sale | Price per Sq Ft | Prior Sale |
|---|---|---|---|---|---|
| 11/14/2025 11/14/25 | Sold | $310,000 | -3.1% | $136 / Sq Ft | View Prior Sale |
| 10/12/2025 10/12/25 | Pending | -- | -- | -- | |
| 10/10/2025 10/10/25 | Price Changed | $320,000 | -5.3% | $141 / Sq Ft | |
| 09/26/2025 09/26/25 | Price Changed | $338,000 | -0.6% | $149 / Sq Ft | |
| 08/25/2025 08/25/25 | For Sale | $340,000 | -- | $150 / Sq Ft |
Purchase History
| Date | Type | Sale Price | Title Company |
|---|---|---|---|
| Deed | -- | -- | |
| Deed | -- | -- | |
| Foreclosure Deed | $193,046 | -- | |
| Deed | $193,300 | -- | |
| Deed | $37,700 | -- |
Mortgage History
| Date | Status | Loan Amount | Loan Type |
|---|---|---|---|
| Open | $150,793 | FHA | |
| Previous Owner | $190,234 | VA |
Source: First Multiple Listing Service (FMLS)
MLS Number: 7638576
APN: 031J-01-169-000
Disclaimer: Certain information contained herein is derived from information provided by parties other than Homes.com. All information provided is deemed reliable, but is not guaranteed to be accurate and should be independently verified.
![]() Listings identified with the FMLS IDX logo come from FMLS and are held by brokerage firms other than the owner of this website. The listing brokerage is identified in any listing details. Information is deemed reliable but is not guaranteed. If you believe any FMLS listing contains material that infringes your copyrighted work please visit www.fmls.com/dmca to review our DMCA policy and learn how to submit a takedown request. © 2025 First Multiple Listing Service, Inc.
Listings identified with the FMLS IDX logo come from FMLS and are held by brokerage firms other than the owner of this website. The listing brokerage is identified in any listing details. Information is deemed reliable but is not guaranteed. If you believe any FMLS listing contains material that infringes your copyrighted work please visit www.fmls.com/dmca to review our DMCA policy and learn how to submit a takedown request. © 2025 First Multiple Listing Service, Inc.
- 300 Monarch Village Way
- 1653 Jersey Dr
- 1341 Kent Manor Unit 3
- 1545 Brangus Dr
- 198 Broder Farms Dr
- 213 Sunderland Way Unit 1
- 591 Creek Valley Ct
- 512 Chaucer Way Unit 1
- 924 Dexter Dr
- 266 Monarch Village Way
- 3916 Champagne Dr
- 4025 Jamaica Dr
- 687 Pathwood Ln
- 223 Monarch Village Way
- 139 Surge Stone Ln
- 469 Village Cir
- 1468 Flippen Rd
- 1448 Flippen Rd
- 486 Village Cir
- 605 Applegate Ln
- 1592 Thornwick Trace
- 1618 Thornwick Trace
- 473 Haven Ridge Dr
- 614 Fairgreen Trail
- 965 Durham Way
- 940 Durham Way
- 628 Fairgreen Trail
- 1457 Buckingham Place
- 408 Fairlawn Dr
- 537 Anglewood Trace
- 405 Chadwick Commons
- 464 Gresham Dr
- 131 Dustin Dr
- 40 Carrera Rd
- 107 Watercress Ct
- 359 Tait Rd
- 413 Gresham Dr
- 4112 Jodeco Rd
- 573 Ransom Way