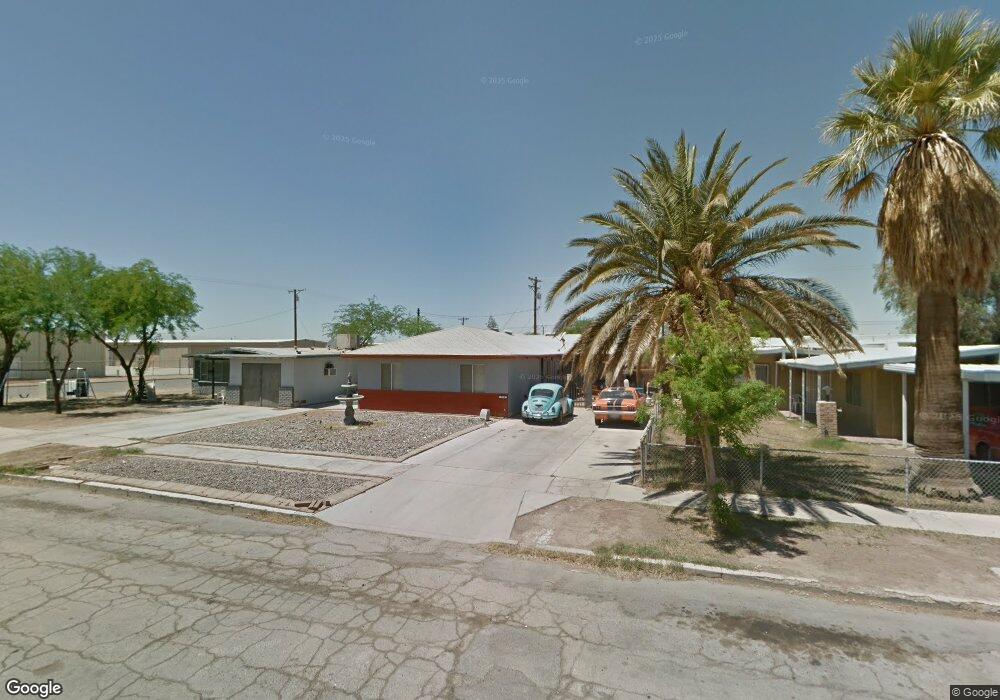
719 S F St Imperial, CA 92251
Estimated Value: $323,000 - $362,030
3
Beds
2
Baths
1,440
Sq Ft
$237/Sq Ft
Est. Value
About This Home
This home is located at 719 S F St, Imperial, CA 92251 and is currently estimated at $341,258, approximately $236 per square foot. 719 S F St is a home located in Imperial County with nearby schools including T.L. Waggoner Elementary School, Frank M. Wright Middle School, and Imperial High School.
Ownership History
Date
Name
Owned For
Owner Type
Purchase Details
Closed on
Jul 10, 2025
Sold by
Gilbert Gregory S and Paz Yolanda
Bought by
Duarte Angela and Ibarra Edward
Current Estimated Value
Home Financials for this Owner
Home Financials are based on the most recent Mortgage that was taken out on this home.
Original Mortgage
$253,125
Outstanding Balance
$252,700
Interest Rate
6.89%
Mortgage Type
New Conventional
Estimated Equity
$88,558
Purchase Details
Closed on
Oct 21, 2019
Sold by
Godsey Jerry W and Godsey Lanette I
Bought by
Gilbert Gregory S and Paz Gilbert Yolanda
Home Financials for this Owner
Home Financials are based on the most recent Mortgage that was taken out on this home.
Original Mortgage
$122,250
Interest Rate
3.7%
Mortgage Type
New Conventional
Create a Home Valuation Report for This Property
The Home Valuation Report is an in-depth analysis detailing your home's value as well as a comparison with similar homes in the area
Home Values in the Area
Average Home Value in this Area
Purchase History
| Date | Buyer | Sale Price | Title Company |
|---|---|---|---|
| Duarte Angela | $337,500 | Chicago Title Company | |
| Gilbert Gregory S | $163,500 | Chicago Title Company |
Source: Public Records
Mortgage History
| Date | Status | Borrower | Loan Amount |
|---|---|---|---|
| Open | Duarte Angela | $253,125 | |
| Previous Owner | Gilbert Gregory S | $122,250 |
Source: Public Records
Tax History Compared to Growth
Tax History
| Year | Tax Paid | Tax Assessment Tax Assessment Total Assessment is a certain percentage of the fair market value that is determined by local assessors to be the total taxable value of land and additions on the property. | Land | Improvement |
|---|---|---|---|---|
| 2025 | $1,949 | $178,478 | $49,212 | $129,266 |
| 2023 | $1,949 | $171,550 | $47,302 | $124,248 |
| 2022 | $1,908 | $168,187 | $46,375 | $121,812 |
| 2021 | $1,879 | $164,890 | $45,466 | $119,424 |
| 2020 | $1,859 | $163,200 | $45,000 | $118,200 |
| 2019 | $1,406 | $129,471 | $37,630 | $91,841 |
| 2018 | $1,386 | $126,934 | $36,893 | $90,041 |
| 2017 | $1,304 | $124,446 | $36,170 | $88,276 |
| 2016 | $1,255 | $122,007 | $35,461 | $86,546 |
| 2015 | $1,268 | $120,175 | $34,929 | $85,246 |
| 2014 | $1,182 | $117,822 | $34,245 | $83,577 |
Source: Public Records
Map
Nearby Homes