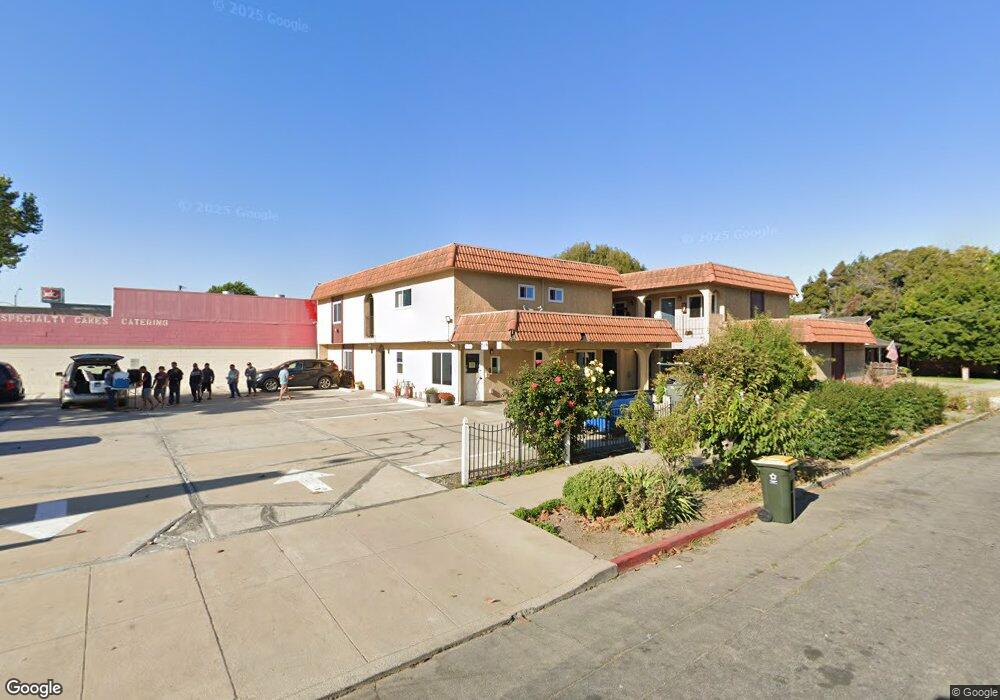
719 S Main St Salinas, CA 93901
South Salinas NeighborhoodEstimated Value: $1,392,328
20
Beds
20
Baths
6,458
Sq Ft
$216/Sq Ft
Est. Value
About This Home
This home is located at 719 S Main St, Salinas, CA 93901 and is currently estimated at $1,392,328, approximately $215 per square foot. 719 S Main St is a home located in Monterey County with nearby schools including Lincoln Elementary School, Mission Park Elementary School, and Monterey Park Elementary School.
Ownership History
Date
Name
Owned For
Owner Type
Purchase Details
Closed on
Oct 28, 2013
Sold by
Mirza Ashfaq Y and Mirza Irshad Y
Bought by
Panchal Vipulkumar N and Panchal Pinkiben S
Current Estimated Value
Home Financials for this Owner
Home Financials are based on the most recent Mortgage that was taken out on this home.
Original Mortgage
$525,000
Outstanding Balance
$395,063
Interest Rate
4.46%
Mortgage Type
Commercial
Estimated Equity
$997,265
Create a Home Valuation Report for This Property
The Home Valuation Report is an in-depth analysis detailing your home's value as well as a comparison with similar homes in the area
Home Values in the Area
Average Home Value in this Area
Purchase History
| Date | Buyer | Sale Price | Title Company |
|---|---|---|---|
| Panchal Vipulkumar N | $650,000 | Chicago Title Company |
Source: Public Records
Mortgage History
| Date | Status | Borrower | Loan Amount |
|---|---|---|---|
| Open | Panchal Vipulkumar N | $525,000 |
Source: Public Records
Tax History
| Year | Tax Paid | Tax Assessment Tax Assessment Total Assessment is a certain percentage of the fair market value that is determined by local assessors to be the total taxable value of land and additions on the property. | Land | Improvement |
|---|---|---|---|---|
| 2025 | $9,482 | $811,660 | $245,166 | $566,494 |
| 2024 | $9,482 | $781,177 | $240,359 | $540,818 |
| 2023 | $9,316 | $765,861 | $235,647 | $530,214 |
| 2022 | $8,974 | $750,845 | $231,027 | $519,818 |
| 2021 | $8,628 | $736,124 | $226,498 | $509,626 |
| 2020 | $8,391 | $755,537 | $224,176 | $531,361 |
| 2019 | $8,369 | $743,948 | $219,781 | $524,167 |
| 2018 | $8,227 | $726,247 | $215,472 | $510,775 |
| 2017 | $8,269 | $715,113 | $211,248 | $503,865 |
| 2016 | $8,316 | $704,809 | $207,106 | $497,703 |
| 2015 | $8,392 | $694,617 | $203,996 | $490,621 |
| 2014 | $7,638 | $663,288 | $200,000 | $463,288 |
Source: Public Records
Map
Nearby Homes
- 22 Willow St
- 123 Chestnut St
- 202 Pine St
- 50 Katherine Ave
- 54 Katherine Ave
- 1 Santa Lucia Ave
- 1051 Padre Dr Unit 7
- 1055 Padre Dr Unit 2
- 321 Hawthorne St
- 14 San Juan Dr
- 307 W Alisal St
- 1051 Riker St Unit 7
- 1067 Padre Dr Unit 2
- 1067 Padre Dr Unit 1
- 333 Hawthorne St
- 1056 Padre Dr Unit 4
- 138 Nissen Rd Unit 1
- 220 Pajaro St
- 134 Nissen Rd Unit 2
- 132 Nissen Rd Unit 3
Your Personal Tour Guide
Ask me questions while you tour the home.