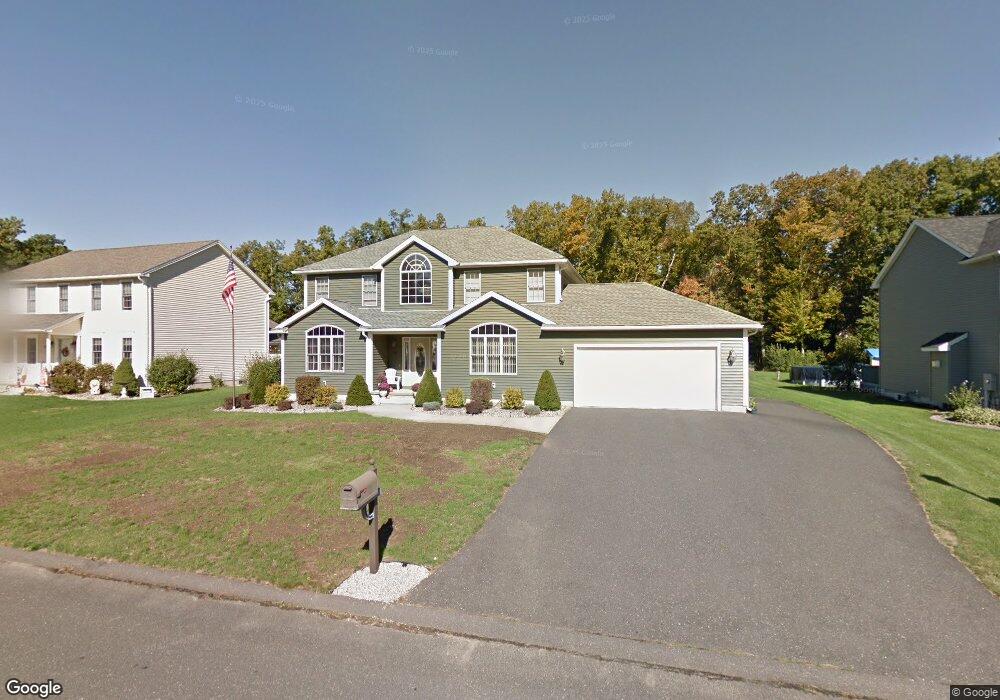
72 Allison Ln Ludlow, MA 01056
Estimated Value: $453,000 - $569,000
3
Beds
3
Baths
1,954
Sq Ft
$251/Sq Ft
Est. Value
About This Home
This home is located at 72 Allison Ln, Ludlow, MA 01056 and is currently estimated at $489,611, approximately $250 per square foot. 72 Allison Ln is a home located in Hampden County with nearby schools including East Street Elementary School, Chapin Street Elementary School, and Paul R. Baird Middle School.
Ownership History
Date
Name
Owned For
Owner Type
Purchase Details
Closed on
Jan 2, 2018
Sold by
Blake 2Nd Michael A and Blake Anabela A
Bought by
Blake Anabela A
Current Estimated Value
Home Financials for this Owner
Home Financials are based on the most recent Mortgage that was taken out on this home.
Original Mortgage
$300,000
Outstanding Balance
$248,970
Interest Rate
3.95%
Mortgage Type
Credit Line Revolving
Estimated Equity
$240,641
Purchase Details
Closed on
Sep 24, 2004
Sold by
Manganaro Home Builder
Bought by
Blake Anabela A and Blake Michael A
Home Financials for this Owner
Home Financials are based on the most recent Mortgage that was taken out on this home.
Original Mortgage
$234,500
Interest Rate
5.89%
Mortgage Type
Purchase Money Mortgage
Create a Home Valuation Report for This Property
The Home Valuation Report is an in-depth analysis detailing your home's value as well as a comparison with similar homes in the area
Home Values in the Area
Average Home Value in this Area
Purchase History
| Date | Buyer | Sale Price | Title Company |
|---|---|---|---|
| Blake Anabela A | -- | -- | |
| Blake Anabela A | $293,140 | -- | |
| Blake Anabela A | $293,140 | -- |
Source: Public Records
Mortgage History
| Date | Status | Borrower | Loan Amount |
|---|---|---|---|
| Open | Blake Anabela A | $300,000 | |
| Previous Owner | Blake Anabela A | $234,500 |
Source: Public Records
Tax History
| Year | Tax Paid | Tax Assessment Tax Assessment Total Assessment is a certain percentage of the fair market value that is determined by local assessors to be the total taxable value of land and additions on the property. | Land | Improvement |
|---|---|---|---|---|
| 2025 | $7,322 | $422,000 | $93,200 | $328,800 |
| 2024 | $7,084 | $391,600 | $93,400 | $298,200 |
| 2023 | $6,949 | $356,200 | $85,500 | $270,700 |
| 2022 | $6,693 | $334,800 | $89,100 | $245,700 |
| 2021 | $6,676 | $316,700 | $89,100 | $227,600 |
| 2020 | $6,444 | $312,500 | $87,800 | $224,700 |
| 2019 | $6,101 | $307,800 | $86,900 | $220,900 |
| 2018 | $5,745 | $302,200 | $86,900 | $215,300 |
| 2017 | $5,592 | $301,800 | $86,200 | $215,600 |
| 2016 | $5,664 | $312,400 | $91,800 | $220,600 |
| 2015 | $5,351 | $309,500 | $90,900 | $218,600 |
Source: Public Records
Map
Nearby Homes
- Lot 602 Grandview Ave
- 382 Holyoke St
- 15 Hilltop Terrace
- 42 Roy St
- 47 Kendall St
- 57 Belmont St
- 482 Holyoke St
- 350 West St Unit 3
- 350 West St Unit 19
- 350 West St Unit 17
- 12 Mariana Ln
- 59 Prospect Gardens
- 119 Blisswood Village Dr
- 98 Fuller St Unit 32
- 70 Fuller St
- 0 Fuller St Unit 73409741
- 166-168 Main St
- 420 West St
- 201 Main St
- 102 Swan Ave
Your Personal Tour Guide
Ask me questions while you tour the home.