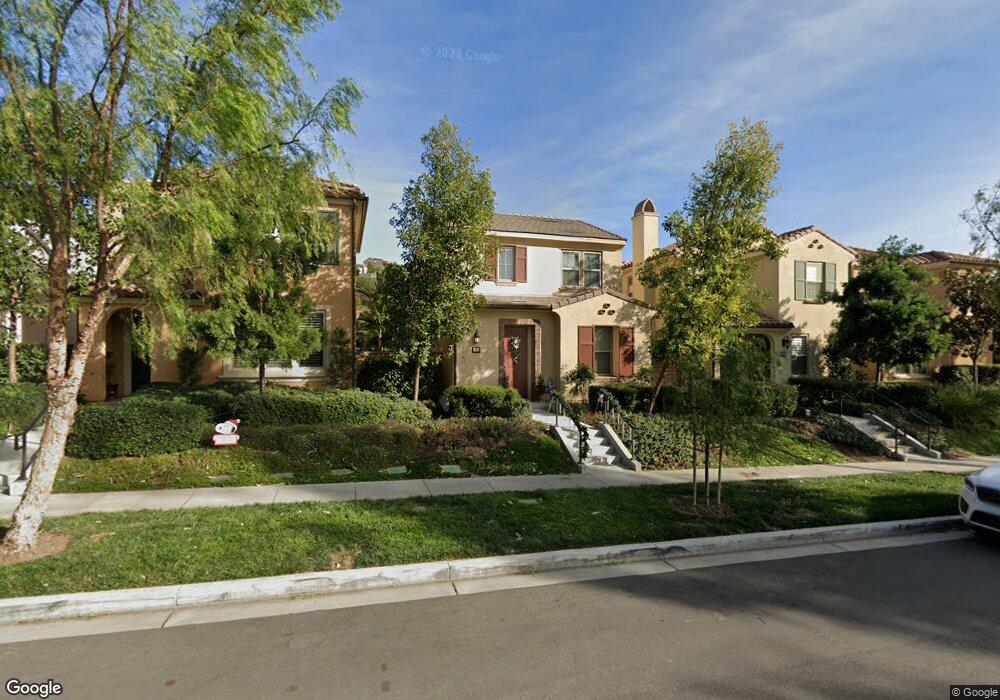
72 Autumn Sage Irvine, CA 92618
Portola Springs NeighborhoodEstimated Value: $1,468,000 - $1,581,000
4
Beds
3
Baths
2,189
Sq Ft
$697/Sq Ft
Est. Value
About This Home
This home is located at 72 Autumn Sage, Irvine, CA 92618 and is currently estimated at $1,526,686, approximately $697 per square foot. 72 Autumn Sage is a home located in Orange County with nearby schools including Portola Springs Elementary, Jeffrey Trail Middle, and Portola High School.
Ownership History
Date
Name
Owned For
Owner Type
Purchase Details
Closed on
Nov 16, 2022
Sold by
Razaque Tauseef and Manaal Farreed
Bought by
Ang Jennifer Siak Ping and Teo Seng Huat
Current Estimated Value
Home Financials for this Owner
Home Financials are based on the most recent Mortgage that was taken out on this home.
Original Mortgage
$645,000
Outstanding Balance
$618,202
Interest Rate
6%
Mortgage Type
New Conventional
Estimated Equity
$908,484
Create a Home Valuation Report for This Property
The Home Valuation Report is an in-depth analysis detailing your home's value as well as a comparison with similar homes in the area
Home Values in the Area
Average Home Value in this Area
Purchase History
We collect this data history from publicly available records. To have your information removed, we recommend requesting removal directly through your county’s website.
| Date | Buyer | Sale Price | Title Company |
|---|---|---|---|
| Ang Jennifer Siak Ping | $1,290,000 | Lawyers Title | |
| Ang Jennifer Siak Ping | $1,290,000 | Lawyers Title |
Source: Public Records
Mortgage History
We collect this data history from publicly available records. To have your information removed, we recommend requesting removal directly through your county’s website.
| Date | Status | Borrower | Loan Amount |
|---|---|---|---|
| Open | Ang Jennifer Siak Ping | $645,000 |
Source: Public Records
Tax History
| Year | Tax Paid | Tax Assessment Tax Assessment Total Assessment is a certain percentage of the fair market value that is determined by local assessors to be the total taxable value of land and additions on the property. | Land | Improvement |
|---|---|---|---|---|
| 2025 | $17,234 | $1,342,116 | $878,220 | $463,896 |
| 2024 | $16,954 | $1,315,800 | $861,000 | $454,800 |
| 2023 | $17,069 | $1,290,000 | $844,117 | $445,883 |
| 2022 | $11,512 | $749,486 | $353,597 | $395,889 |
| 2021 | $11,363 | $734,791 | $346,664 | $388,127 |
| 2020 | $11,276 | $727,257 | $343,109 | $384,148 |
| 2019 | $11,183 | $712,998 | $336,382 | $376,616 |
| 2018 | $11,192 | $699,018 | $329,786 | $369,232 |
| 2017 | $11,006 | $685,312 | $323,319 | $361,993 |
| 2016 | $10,867 | $671,875 | $316,979 | $354,896 |
| 2015 | $10,765 | $661,783 | $312,217 | $349,566 |
| 2014 | $10,632 | $648,820 | $306,101 | $342,719 |
Source: Public Records
Map
Nearby Homes
- 38 Upperbend
- 36 Upperbend
- 42 Upperbend
- 24 Ridge Valley
- 32 Upperbend
- 26 Ridge Valley
- 30 Upperbend
- 28 Ridge Valley
- 72 Autumn Sage
- 72 Autumn Sage
- 72 Autumn Sage
- 74 Autumn Sage
- 71 Sacred Path
- 28 Upperbend
- 30 Ridge Valley
- 54 Conservancy
- 54 Conservancy Unit 67
- 70 Autumn Sage
- 15 Arrowhead Unit 17
- 1953 Land Grant
Your Personal Tour Guide
Ask me questions while you tour the home.