Estimated Value: $565,000 - $773,000
3
Beds
3
Baths
2,214
Sq Ft
$302/Sq Ft
Est. Value
About This Home
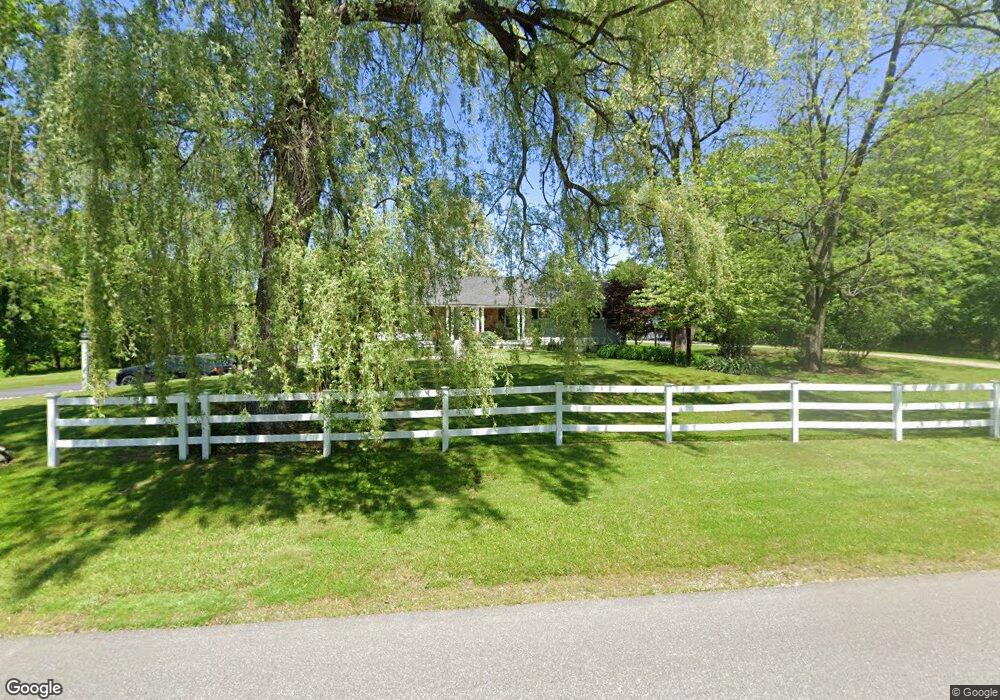
This home is located at 72 Lane Rd, Derry, NH 03038 and is currently estimated at $669,066, approximately $302 per square foot. 72 Lane Rd is a home with nearby schools including Derry Village School, West Running Brook Middle School, and Pinkerton Academy.
Ownership History
Date
Name
Owned For
Owner Type
Purchase Details
Closed on
Sep 14, 2001
Sold by
Amico Vincent
Bought by
Owen Mark D
Current Estimated Value
Home Financials for this Owner
Home Financials are based on the most recent Mortgage that was taken out on this home.
Original Mortgage
$209,600
Interest Rate
6.99%
Purchase Details
Closed on
Sep 19, 1996
Sold by
Fhlmc
Bought by
Amico Vincent and Amico Lori
Home Financials for this Owner
Home Financials are based on the most recent Mortgage that was taken out on this home.
Original Mortgage
$55,250
Interest Rate
7.89%
Purchase Details
Closed on
Jan 26, 1996
Sold by
Alden Jane T
Bought by
Fhlmc
Create a Home Valuation Report for This Property
The Home Valuation Report is an in-depth analysis detailing your home's value as well as a comparison with similar homes in the area
Home Values in the Area
Average Home Value in this Area
Purchase History
| Date | Buyer | Sale Price | Title Company |
|---|---|---|---|
| Owen Mark D | $262,000 | -- | |
| Amico Vincent | $85,000 | -- | |
| Fhlmc | $87,500 | -- |
Source: Public Records
Mortgage History
| Date | Status | Borrower | Loan Amount |
|---|---|---|---|
| Open | Fhlmc | $222,350 | |
| Closed | Fhlmc | $93,000 | |
| Closed | Fhlmc | $209,600 | |
| Previous Owner | Fhlmc | $55,250 |
Source: Public Records
Tax History Compared to Growth
Tax History
| Year | Tax Paid | Tax Assessment Tax Assessment Total Assessment is a certain percentage of the fair market value that is determined by local assessors to be the total taxable value of land and additions on the property. | Land | Improvement |
|---|---|---|---|---|
| 2024 | $12,044 | $644,400 | $234,900 | $409,500 |
| 2023 | $11,417 | $552,100 | $199,700 | $352,400 |
| 2022 | $9,742 | $511,684 | $169,984 | $341,700 |
| 2021 | $9,564 | $386,281 | $129,881 | $256,400 |
| 2020 | $9,402 | $386,281 | $129,881 | $256,400 |
| 2019 | $8,653 | $331,277 | $100,277 | $231,000 |
| 2018 | $8,623 | $331,277 | $100,277 | $231,000 |
| 2017 | $8,429 | $292,063 | $95,263 | $196,800 |
| 2016 | $8,128 | $300,363 | $95,263 | $205,100 |
| 2015 | $8,081 | $276,463 | $95,263 | $181,200 |
| 2014 | $8,134 | $276,463 | $95,263 | $181,200 |
| 2013 | $8,132 | $258,235 | $87,235 | $171,000 |
Source: Public Records
Map
Nearby Homes
- 87 Island Pond Rd
- 100 Rockingham Rd Unit 9
- 139 Rockingham Rd Unit 21
- 139 Rockingham Rd Unit 30
- 144 Rockingham Rd
- 4C Pine Isle Dr Unit B
- 13 Craven Terrace
- 7 Dexter St
- 14 True Ave
- 2 Remington Ct
- 4 Colony Brook Ln
- 5 Sunnyside Ln Unit R
- 7 Chester Rd Unit 211
- 7 Chester Rd Unit 212
- 2 Silvestri Cir Unit 13
- 2 Silvestri Cir Unit 6
- 51 Chester Rd
- 5 Nesmith St
- 5A Homestead Dr Unit A
- 5A Homestead Dr